Citigroup and Implied Volatility
Consider for a moment that much beleaguered Citigroup (C) is going to report earnings tomorrow morning on options expiration day.
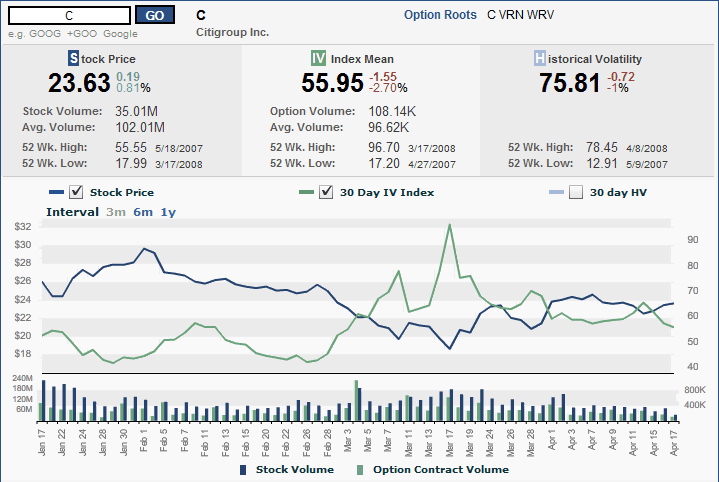
Shouldn’t implied volatility tell us something about how anxious investors should be? Well, that is indeed the case, but the story is not perhaps what one might expect. If implied volatility is to believed, anxiety about Citigroup’s plight peaked about a month ago (when the stock market bottomed) and has been declining ever since. At current levels, Citigroup’s implied volatility is at the lowest level it has been in the past six weeks.
I have included Citigroup’s three month implied volatility chart below, as it is too interesting to let this one go and should make nice fodder for the archives.


3 comments:
very nice observation Bill. I'm wondering where you can get the chart?
Hi Henry,
The chart is from the ISE. You can find the ISE's quotes/volatilty charts here
If some one wants expert view on the topic of blogging
and site-building afterward i recommend him/her to pay a quick visit
this blog, Keep up the fastidious work.
Feel free to visit my site: bmi chart for men
Post a Comment