Complacency Up Pre-FOMC
For anyone who follows the VIX, the headline above should not come as a surprise, but here the indicator adds a little color to the story.
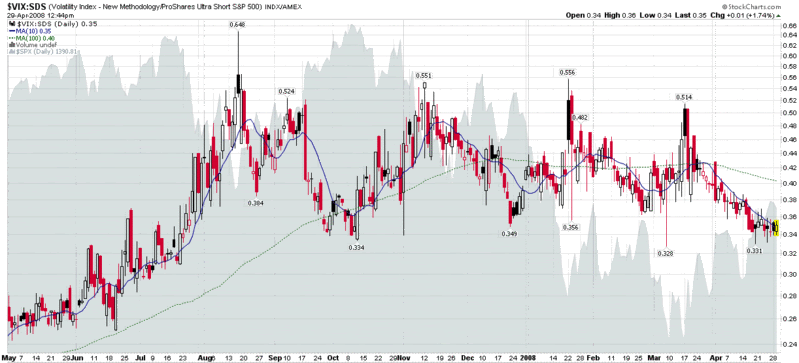
The VIX:SDS ratio is something I introduced last August. In essence, it plots the VIX against the 2x inverse ETF of the SPX to help determine to what extent the VIX is just moving in the opposite direction of the SPX and to what extent there is an emotional component – either fear or complacency – in addition to the normal negative correlation.
As seen in the chart below, the VIX:SDS ratio has been largely moving sideways since September, but has been drifting steadily lower since the markets bottomed in March. More importantly, the current VIX:SDS ratio is also approaching levels not sustained since July, when the credit crisis had not yet begun to unfold. Also of interest is the 0.05 differential between the 10 day and 100 day simple moving averages, reflecting that current levels of complacency are the highest in relative terms since the launch of the SDS ETF in July 2006.
As always, where there is excessive complacency, bulls should exercise extra caution.


0 comments:
Post a Comment