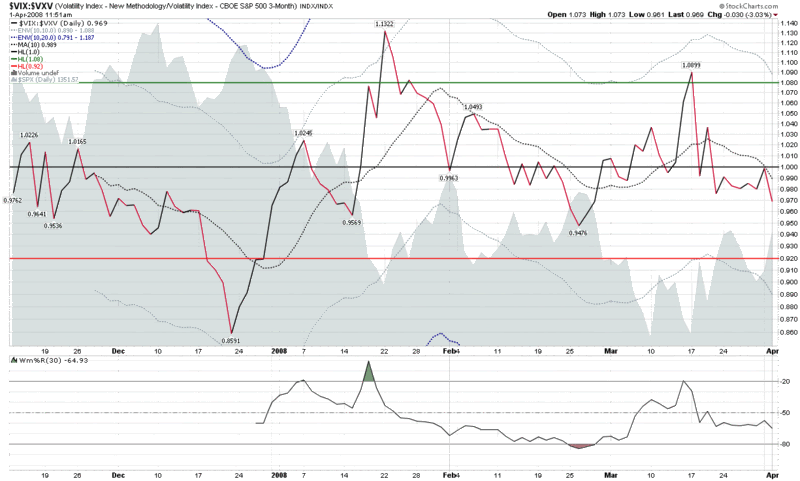
VIX:VXV Not Signaling Overbought Market
With the VIX trading at its lowest level (23ish) since late February, there are a number of investors who are trying to determine whether a falling VIX signals an overbought situation in the market.
There are many ways to use the VIX as a market sentiment indicator to assist in calling tops and bottoms. The most widely used is probably to determine the distance the VIX is from the 10 day simple moving average and get long if the VIX is 10% above the 10 day SMA and short if the VIX is 10% below the 10 day SMA. A simple plot of the VIX and the appropriate moving average envelopes will do the trick here – and also indicate that the markets are currently in an overbought condition.
Another way to use the VIX – and one which I continue to have high hopes for as the historical record evolves – is to use the ratio of the VIX (30 day implied volatility for SPX options) to the VXV (93 day IV for the SPX options) to determine the extent to which current volatility readings deviate from future volatility expectations. I have discussed this VIX:VXV ratio on a number of occasions and have continued to observe the predictive value of extreme readings. Now that I have the benefit of 4 ½ months of VXV data, I can say that the ratio continues to generate useful readings – and suggests that the current market is not particularly overbought (see chart below.)
I will continue to monitor instances in which the SMA +/- 10% rule and the VIX:VIX ratio rule(s) diverge and provide periodic updates in this space.


5 comments:
This is one of my favorite indicators. Thank you for elucidating it on your blog.
I have updated my comments on the SPX:VIX indicator. I have also taken the liberty of linking your blog. Very interesting analyses.
Kudos
Thanks for the heads up on the SPX:VIX ratio, Bruce. Also, thanks for the link.
For those who have not yet visited Bruce's blog, I can highly recommend it. The next time I update my blogroll, TraderPsychology will certainly be among the new additions.
Cheers and thanks for all your contributions,
-Bill
The VIX is an excellent market sentiment indicator to gauge the market psychology. Study it well as you may be able to see a storm coming.
The VIX is an excellent market sentiment indicator to gauge the market psychology. Study it well as you may be able to see a storm coming.
Post a Comment