Showing posts with label IBB. Show all posts

Tuesday, April 15, 2014

The Correction As Seen in the ETP Landscape

Since stocks bottomed in March 2009, I have periodically been publishing an SPX pullback table and occasionally a plot of all those pullbacks and their duration. The recent selloff in stocks, however, has been anything but an SPX pullback. I toyed with the idea of presenting comparable data for the NASDAQ Composite or NASDAQ-100 Index (NDX), but here again, the selling has been disproportionate in some areas of the NASDAQ universe, even though it has been hit harder than the SPX.

This time around I have opted instead for a chart that shows the peak-to-trough drawdown across the equity ETP universe, focusing on sector groups that I believe are among the most important to watch.

ETP Landscape 2014 DDs 041514

[source(s): Yahoo, VIX and More]

The data above cover only 2014 and indicate the maximum drawdown since the 2014 peak. While many of these maximum drawdowns are from earlier today, there are quite a few instances in which the maximum drawdown was established earlier in the year.

Note that while the NASDAQ gets most of the attention, it is the small caps (IWM) that have suffered the most among the major market index ETPs.

Not surprisingly, biotechnology (IBB), social media (SOCL) and Russia (RSX) have seen the largest declines, but among cyclicals, defensive stocks and European country ETPs, there is very little to choose from.

Finally, just for fun I have added four alternative ETPs with an equity flavor (SPLV, PBP, CWB and PFF) to show how low volatility, covered call, convertible bond and preferred stock ETPs have fared.

Related posts:

Disclosure(s): none

Thursday, July 31, 2008

Biotech Breakout Confirmed

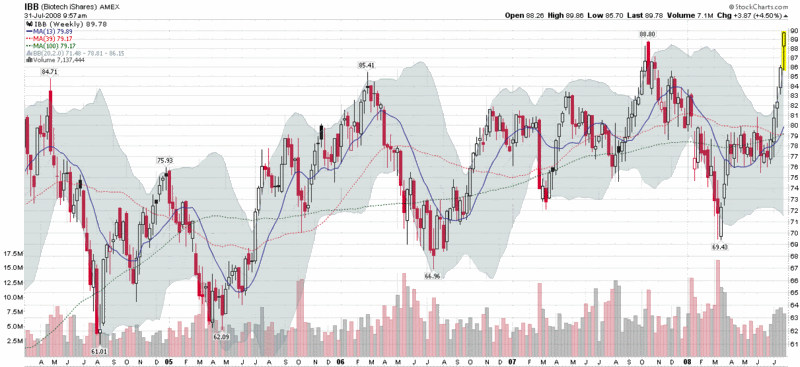
Further to my Biotech on a Tear post earlier this week, today’s action confirms that biotechnology stocks are officially breaking out. The chart below is a weekly chart of IBB, the most active of the biotechnology ETFs. It shows the ferocity of the biotech move over the course of the past month, even in the face of recent disappointing news on the Alzheimer’s front that battered Elan (ELN) and Wyeth (WYE).

Factoring in today’s 3% gain, IBB is set to close at a level not seen since the end of 2001. Note also that the candlestick patterns for the previous highs made in 2004, 2006, and 2007 all show a significant reversal pattern during the week in which those highs were made. With one more day in the week and a large buffer, the current chart pattern is likely to print a bullish pattern for the full week, in addition to the new high.

If you want to see what is hot in the biotech world, the sortable biomedical sector list at Barchart.com is a good place to start.

Tuesday, July 29, 2008

Biotech on a Tear

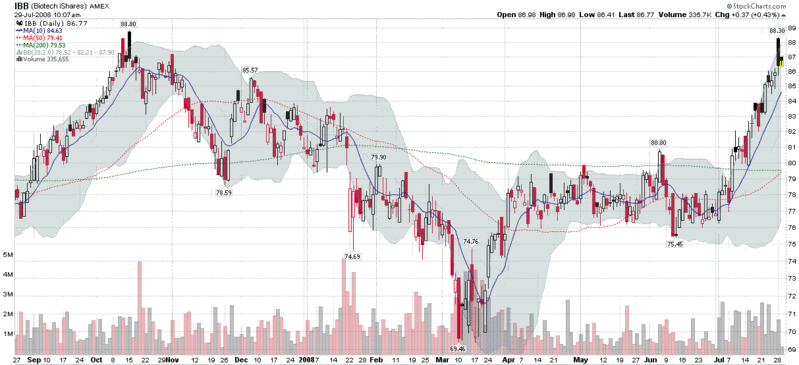
While most sectors have been faltering for the past month or two, biotechnology has been an exceptional performer, with the top biotech ETF, IBB, now more than 15% above its June low, as the chart below shows.

I last profiled biotech on May 1st in Time for Biotech to Turn Around? In retrospect, May and June were excellent months to get long biotech, even as the broad markets headed south.

Of IBBs top ten holdings, five of the ten are currently at or just below their 52 week highs, including:

  • Amgen (AMGN) – making another new 52 week high today
  • Illumina (ILMN) – made a new 52 week high yesterday
  • Celgene (CELG) – just 1.6% below its 52 week high
  • Gilead Sciences (GILD) – 5.7% below its 52 week high, but up about 40% for the year
  • Genzyme (GENZ) – 7.1% below the 52 week high, set back in January

Of course, there are many more success stories among some of the smaller cap biotechnology companies. So while the markets drift sideways and we wait to see if traditional technology stocks can provide leadership, this might be a good time to stock up on one of the few strong sectors: biotechnology.

DISCLAIMER: "VIX®" is a trademark of Chicago Board Options Exchange, Incorporated. Chicago Board Options Exchange, Incorporated is not affiliated with this website or this website's owner's or operators. CBOE assumes no responsibility for the accuracy or completeness or any other aspect of any content posted on this website by its operator or any third party. All content on this site is provided for informational and entertainment purposes only and is not intended as advice to buy or sell any securities. Stocks are difficult to trade; options are even harder. When it comes to VIX derivatives, don't fall into the trap of thinking that just because you can ride a horse, you can ride an alligator. Please do your own homework and accept full responsibility for any investment decisions you make. No content on this site can be used for commercial purposes without the prior written permission of the author. Copyright © 2007-2023 Bill Luby. All rights reserved.
 
Web Analytics