Showing posts with label bull put spread. Show all posts

Sunday, November 6, 2016

How to Play a Volatility Spike (Guest Columnist at Barron’s)

Yesterday, I was pleased to once again have an opportunity to pen a guest column for Barron’s, pinch hitting for Steve Sears in his The Striking Price column with How to Play a Volatility Spike.  If my math is correct, this is the nineteenth time I have been a guest columnist in this fashion.  I always try to keep my subject matter linked to current events, but the irony is that when the signal comes to grab my bat and make my way to the on-deck circle, invariably the markets are hit with a bout of volatility.  The result is that as a “volatility guy” I often end up talking about what to do in an environment of elevated volatility, as was the case in Seizing Opportunity from Stock Market Volatility, Be Greedy While Others Are Fearful, Calm Down and Exploit Others’ Anxieties and There’s Opportunity in Uncertainty.

My thesis in the Barron’s article is fairly simple and should not come as a surprise to those who have been paying attention to what I have been saying in this space over the course of the past decade:  VIX spikes are typically a gift from the mean reversion gods.  The trick, of course, is in the timing of the mean reversion – and perhaps whether to bother to make the distinction between mean reversion and median reversion.

In the chart below, one can see VIX data going back to 1990, with the mean of 19.71 added as a dotted red line.  Even a quick glimpse at the graphic reveals just how difficult it is for an elevated VIX to stay elevated, regardless of the cause.


 [source(s):  StockCharts.com, VIX and More]

The Barron’s article talks about some trading opportunities that arise from VIX spikes and includes a bull put spread trade idea involving QQQ

I have remarked on a number of occasions in the past that whenever Steve Sears reaches out to me to pen a guest column, inevitably some invisible market force snaps to attention and arranges for a volatility spike.  Either Steve has some amazing insight into the future of volatility (not unthinkable for a guy who was a driving force behind the creation of the ISEE Index) or some other unseen forces are toying with me.  If this happens one more time I am going to start to wonder if I have an obligation to publicly disclose future column requests…

In the meantime, tune out as much of the election hysteria as you can and consider all the gifts from the mean reversion gods that looked too risky to accept at the time.

Related posts: 

A full list of my (19) Barron’s contributions:


Disclosure(s): the CBOE is an advertiser on VIX and More

Saturday, March 12, 2016

Playing Volatile Oil Prices (Guest Columnist at Barron’s)

Today I penned my eighteenth guest column for Barron’s, filling in for Steve Sears and the venerable The Striking Price options column.  Looking back, I was surprised to see that this is the eighth year I have been contributing to Barron’s and while I have generally tilted in the direction of volatility topics during this period, I always like to keep my thoughts topical, but with an unusual twist or two.

In Playing Volatile Oil Prices:  The ins and outs of the backspread trade, I tackled the recent huge moves in crude oil prices, touched upon some of the fundamental and technical influences on the price of crude and used the current environment of chaos following a huge short squeeze as a backdrop to talk about the opportunities associated with a call backspread.

As Barron’s prefers to structure trade ideas around ETPs or single stocks, I elected to use the popular U.S. Oil Fund (USO) ETP as my underlying, though I also like the idea of call backspreads in oil and gas exploration and production (XOP) or Russia (RSX), though the Russia ETP has limited liquidity.  As an aside, readers of this blog will surely know that the prices of futures-based ETPs such as USO and VXX, among others, are strongly influenced by the roll yield associated with the shape of the futures curve.  For this reason, USO acts most like West Texas Intermediate crude oil in the short-term, but over longer periods the price of USO is more strongly affected by the term structure of crude oil futures, similar to the issues associated with VXX and the VIX.

While the Barron’s column discusses the rationale for the trade and some of the details surrounding it, I thought I would post a profit and loss graphic for the USO April 1x2 10.5/11.5 call backspread here as a companion to the Barron’s material.


[source(s):  LivevolPro / CBOE, VIX and More]

I am sure this particular call backspread trade idea is not for everyone, yet I think it is important for everyone to internalize backspreads, their P&L chart and some of the tweaks that can be made.  For instance, one can dramatically change probabilities and payoffs by modifying strikes (including making use of in-the-money strikes, for instance) and expirations, whereas the credit or debit for entering the trade is something that can be strongly influenced by adjusting the ratios to the likes of 2x3, 4x5, etc.

Also of note, readers who are new to backspreads may wish to brush up on bear call spreads (and bull put spreads) before tackling backspreads, as I like to think of backspreads as short vertical spreads that are supplemented by the purchase an extra out-of-the-money option in the time-honored tradition of swinging for the fences with some of the profits from a spread trade.

As I concluded in the column, “In the options world, there are very few trades where you can make money should the underlying shares move sharply in either direction. Backspreads are intriguing in that they have limited risk, unlimited reward (in one direction), and can make money if the underlying moves either up or down.”

Related posts:

A full list of my (18) Barron’s contributions:


Disclosure(s): long XOP and short VXX at time of writing; Livevol and CBOE are advertisers on VIX and More

Saturday, July 11, 2015

Seizing Opportunity From Stock Market Volatility (Guest Columnist at Barron’s)

Steve Sears and I have a running joke that whenever I am tapped as a guest columnist for The Striking Price at Barron’s, we should both start buying VIX calls as inevitably something is going to come along and cause a volatility spike just in time to give me something topical to discuss.

This time around I thought China might be the culprit or Greece or Puerto Rico or the Fed or maybe even the NYSE. In fact, it was a cocktail of everything that has turned a relatively quiet Q2 into a much more menacing volatility environment in Q3. In Seizing Opportunity From Stock Market Volatility, which appears today in Barron’s, I turn my attention to small caps (RUT, IWM) and use IWM vs. SPY as a way to think about relative volatility in the context of exposure to China, the euro zone and a strong dollar. Focusing on the Russell 2000 Volatility Index (RVX) and VIX, investors have been attributing roughly the same level of uncertainty and relative risk for small caps as large caps, which I see as questionable when one considers the very different exposure each asset class has to global issues and the dollar.

Given that RVX futures (VU) are thinly traded, it probably does not make sense to be short VU and long VX, the VIX futures. Another way to translate the thinking above into a strict volatility trade would be to short an at-the-money straddle for RUT or IWM, while going long an at-the-money straddle for SPX or SPY. That type of trade is probably a stretch for most Barron’s readers, but I suspect is probably right in the wheelhouse of many readers in this space. For the Barron’s article, I came up with something simpler to execute, an IWM Aug 121/123 bull put spread, which has both volatility and directional components to it and is disengaged from volatility in SPX/SPY.

In the Barron’s article, I talk a little bit about selling volatility in a post-crisis market environment or following a significant volatility event, observing:

“Selling options on the downslope of a volatility spike is often only marginally less profitable than selling options at the top of a volatility spike.”

If any of this sounds a little bit like a corollary to some of my work on “disaster imprinting” then some readers clearly have very good memories.

Related posts:

A full list of my (16) Barron’s contributions:

Disclosure(s): none

Thursday, April 28, 2011

Reader Q and A: Straddles and Implied Volatility

Right before the close last Wednesday I placed an ATM straddle that proved to be profitable and I closed it after the IV spike on Thursday. I shouldn't have come back for more, but I placed another ATM straddle Monday before the close and even with the huge drop in price on Tuesday the IV collapse only allowed me to break even. These were my first two super short term volatility trades and now I now that the free IV data on the CBOE's website is an end of day service... definitely wouldn't have placed that trade on Monday afternoon. Seeing now that I possibly should have been doing the opposite, shorting volatility, do you suggest any strategies that aren't outright short and don't require a big amount of margin to be put up? 

Also, what service do you use to view real-time IV for ETFs and such?
Adam C.

Hi Adam,

As a newbie, you should make an important distinction between options trades that have unlimited risk and those that you should characterize as limited risk or defined risk. Shorting 10 SLV July 47 calls theoretically opens you up to unlimited risk because SLV can continue to go up and up. Should this happen, depending upon your cash cushion, eventually your broker will hit you with a margin call and you will be forced to cover at a significant loss.

Take the same basic trade and add a second leg as a hedge and your unlimited risk is now limited. Instead of a naked short, a bear call spread involving 10 short SLV July 47 calls plus 10 long SLV July 50 calls caps your loss at the distance between the two strikes. Here that is 50-47 or three points. Three points times 10 options (with a 100 multiplier) puts your maximum loss at $3000.

Make that trade right now and for 10 contracts you should receive a credit of about $1.20 for that spread, so that means your maximum profit is $1200 and maximum loss is $3000 - $1200 or $1800.

This is a directional bet. For a non-directional bet – meaning that you expect SLV to be at about 47.00 at the time of the July expiration, you should probably focus on condors and butterflies, which are essentially the limited risk version of strangles and straddles. Sometimes you will hear a trader refer to “buying the wings.” What that means is they are converting an unlimited risk strangle or straddle into a limited risk condor or butterfly by buying out-of-the-money legs to hedge their risk, just as was the case with the call spread example above. As a matter of fact, one way to think about an iron condor is that it is just a bear call spread plus a bull put spread. Early on I used a more generic label of vertical credit spread on the blog for these strategies. You should be able to follow any of these links to get more information.

An even better way to get up to speed on these strategies is with some online resources. A good place to start is with the Options Industry Council (OIC), where they have an Options Strategy Index. Click on any strategy diagram for more information. Among the many great resources out there, I can highly recommend the CBOE’s Options Institute, where you might want to start with their tutorials. Keep in mind that the options brokers also do an excellent job of educating their customers on options strategies. Two that put a great deal of effort into education are optionsXpress (Education Center) and thinkorswim (Swim Lessons).

Also, the links below should provide some specific posts that will give you some food for thought regarding your recent SLV (?) trade and some alternative approaches.

In terms of real-time IV, I use Livevol Pro, which provides the graphs that I use on the blog for implied volatility and historical volatility. Your favorite options brokers (thinkorswim, optionsXpress, TradeMONSTER, Options House, Trade King, etc.) should also have good real-time or nearly real-time IV data. If you don't have an account at a broker that specializes in options, I highly recommend you open up one with at least one of the brokers mentioned above so you can get your data and place your trades on the same platform.

Related posts:
Disclosure(s): Short SLV at time of writing; Livevol, CBOE, optionsXpress, TradeMONSTER, Options House and Trade King are advertisers on VIX and More

Thursday, January 15, 2009

Selling Naked Puts in Current Environment

During my recent trilogy on the put-write strategy, my intent was to identify an approach that performs well in a non-trending market. While I still believe we are stuck in a range defined by about 820-980 on the S&P 500 index, a strategy that involves selling puts generally performs at maximum levels toward the bottom of a well-defined trading range. In short, the current situation looks like an excellent time to write some cash-secured puts.

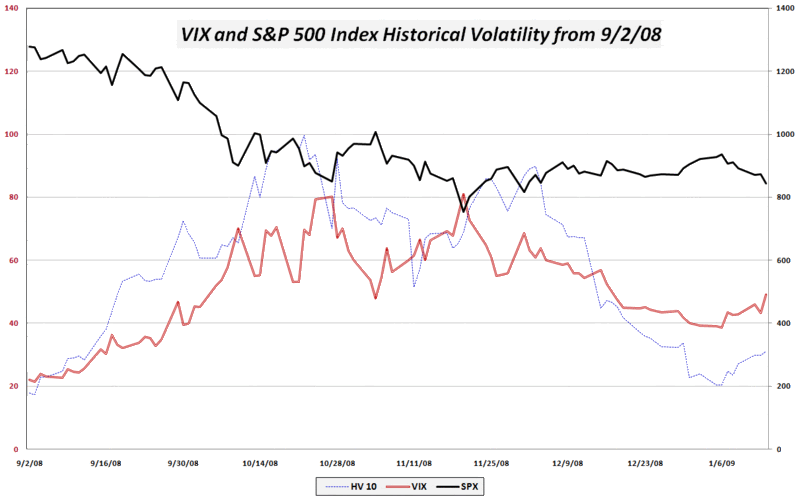
Several factors indicate that the timing for put sales may be ideal right now. With the VIX up over 51 once again as the market opens this morning and most measures of short-term historical volatility (such as the 10 day HV in the chart below) showing that the VIX is well above actual volatility we have experienced during the past few weeks, a likely conclusion is that volatility is overpriced at current levels. Further, with the SPX right at 830 as I type this, we are near the bottom of the trading range in the SPX, with significant support likely to be found in the 820-830 range.

Finally, the news flow has been so negative lately, from financials to retailers to Steve Jobs to global trade, etc. that a larger fear and anxiety component is starting to creep into implied volatility measures like the VIX.

For those looking to limit risk, cash-secured puts on indices or ETFs covering a group of stocks can help to eliminate single stock down side risk. Those who are interested in limiting risk from writing puts may prefer to look at a bull put spread, where the writer sells a put near the money and buys another out of the money put to limit losses.

[source: VIX and More]

Wednesday, October 15, 2008

Implied Volatility Over 150 in EWZ, the Brazil ETF

Truth be told, I could pick a ticker at random and have a compelling chart of implied volatility. Some, of course, are more compelling than others.

Take EWZ, for instance, the Brazil ETF. This resource-rich country has seen its ETF lose more than half of its value over the past year, coupled with a dramatic rise in volatility over the course of the past month.

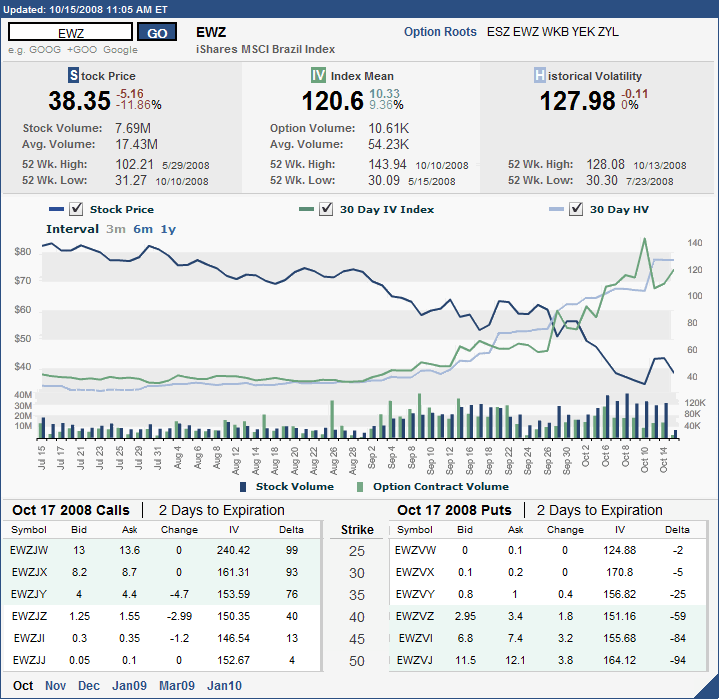
In the chart below, courtesy of the International Securities Exchange, one can discern that implied volatility and historical volatility had been hovering in the range of 40 even as the ETF trended down during the summer. Starting in early September, the increase in volume in both the ETF and the options hints than an even wilder ride is coming.

In fact, implied volatility spiked from 40 to over 140, with historical volatility making similar gains. At the moment, both mean IV and HV are over 120, with both the near the money calls and puts expiring at the end of the week showing implied volatility readings in excess of 150. This is country risk at extreme levels.

Those with a directional preference who are looking to limit risk in high volatility environments may wish to look at bear call spreads for a short bias and bull put spreads for a long bias.

[source: International Securities Exchange]

[Disclosure: long EWZ at time of writing]

DISCLAIMER: "VIX®" is a trademark of Chicago Board Options Exchange, Incorporated. Chicago Board Options Exchange, Incorporated is not affiliated with this website or this website's owner's or operators. CBOE assumes no responsibility for the accuracy or completeness or any other aspect of any content posted on this website by its operator or any third party. All content on this site is provided for informational and entertainment purposes only and is not intended as advice to buy or sell any securities. Stocks are difficult to trade; options are even harder. When it comes to VIX derivatives, don't fall into the trap of thinking that just because you can ride a horse, you can ride an alligator. Please do your own homework and accept full responsibility for any investment decisions you make. No content on this site can be used for commercial purposes without the prior written permission of the author. Copyright © 2007-2023 Bill Luby. All rights reserved.
 
Web Analytics