Showing posts with label contagion. Show all posts

Sunday, May 16, 2010

Chart of the Week: VSTOXX, VIX and the Risk of Global Contagion

Several weeks ago, The New York Time ran an excellent graphic showing the interconnectedness of European debt in Europe’s Web of Debt. Other sources periodically trot out various charts of credit default swaps (CDS), but I have yet to see a graphic which attempts to measure the risk of global contagion.

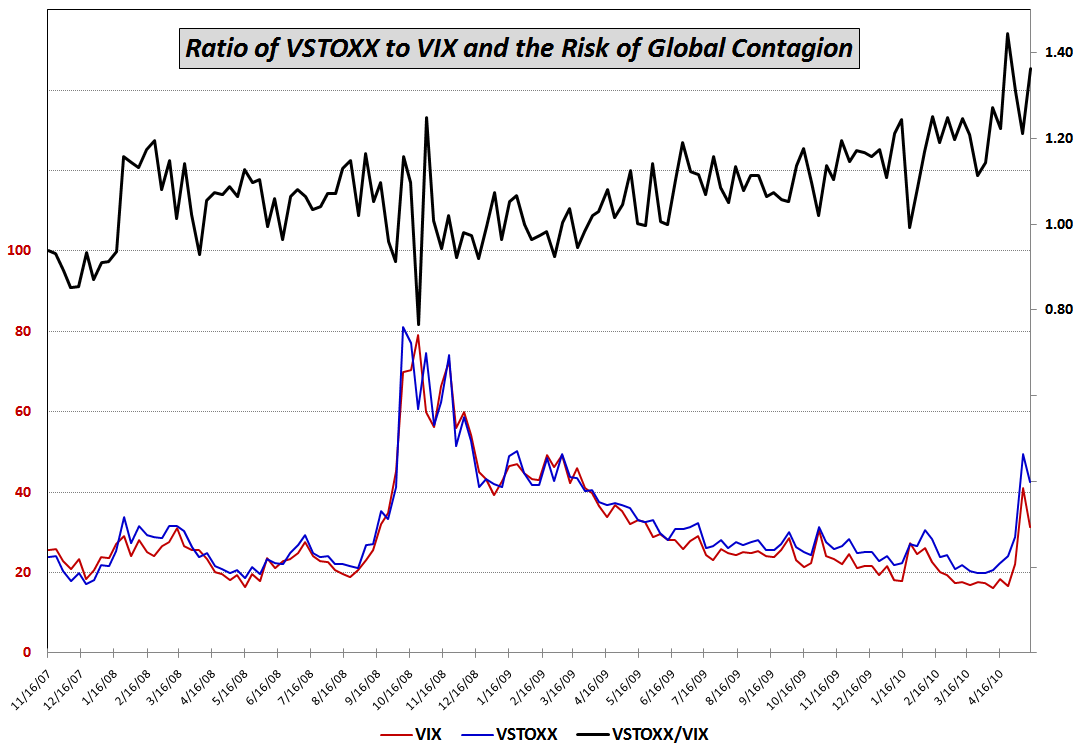
This week’s chart of the week is an attempt to reduce a hypothesis about global contagion to a simple ratio chart. The hypothesis is that whereas the VIX is the best measure of uncertainty in the U.S. stock market and the VSTOXX (which is based on the EURO STOXX 50) is the best measure of uncertainty for euro zone stocks, the ratio of the VSTOXX to the VIX should capture the relative uncertainty for euro zone stocks vs. U.S. stocks. One would expect, therefore, that if VSTOXX is rising faster than the VIX, that options traders are expecting much higher uncertainty (and downside risk) in the euro zone than in the United States. This type of action would support a decoupling theory in which stock markets in the euro zone and the U.S. would begin to move independently of each other. On the other hand, should the VIX be rising at the same rate as VSTOXX, this would suggest that uncertainty and risk are roughly the same in the euro zone and the U.S. and that the risk of global contagion is relatively high.

The chart below is a weekly chart of VSTOXX and the VIX going back to November 2007, just after stocks peaked. Looking at the ratio during the past 2 ½ years, it shows that VSTOXX peaked relative to the VIX three weeks ago, pulled back dramatically up to last week, then surged up through Friday, where the ratio had its second highest weekly close. The verdict from the ratio seems to be that the risk of global contagion is high, slightly below the all-time high, but on the rise.

I will have more about the VSTOXX:VIX ratio going forward.

For more on related subjects, readers are encouraged to check out:


[source: STOXX, CBOE]

Disclosure(s): short VIX at time of writing

Monday, March 12, 2007

The VDAX and the VIX in the Wake of 2/27

When I introduced the VDAX in this space back on 2/22, volatility was hibernating with the bears on each and every continent and my commentary focused on the high degree of correlation between the VIX and the VDAX. I noted that the two indices often trade in tandem, but pointed out that the VDAX sometimes lags the VIX by one trading day or even two.

With the surge in volatility on the heels of 2/27, this seems like a good time to revisit some of those ideas.

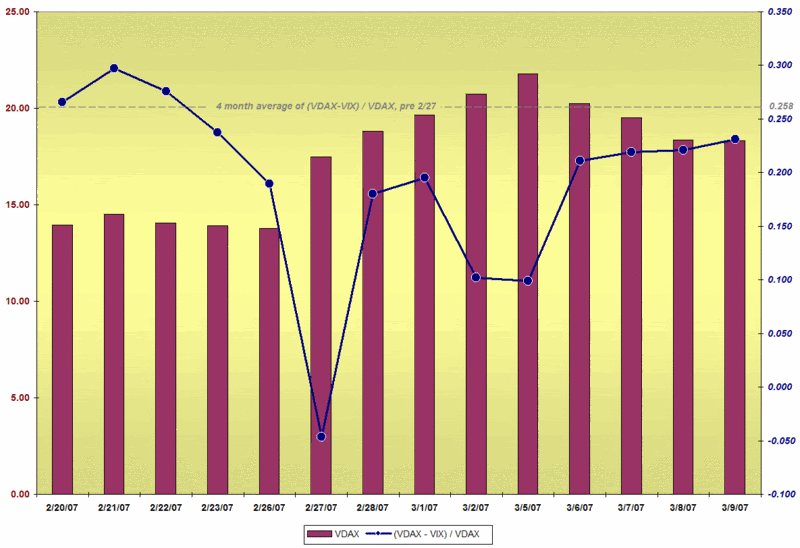
Looking at the data for the four months leading up to 2/27, the difference between the VDAX (VDAX-NEW) and the VIX as a percentage of the VDAX ranged between 17% and 36%, with a mean of about 26% (plotted below as a dashed gray line.)

On February 27, the German markets closed well before the US markets; by the time the VIX had closed for the day, it was trading 5% higher than the VDAX. Over the next week or so, you can see where the VIX and VDAX played lead-lag cat and mouse, as global players tried to place bets ahead of any signs of increasing or lessening international contagion. Only in the last several days, has the VDAX-VIX spread ratio settled into a relatively narrow trading range, which I would interpret as a sign that the major players in the volatility markets believe that the probability of increased volatility or contagion is starting to subside. Whether these traders can accurately help predict the future remains to be seen, but when they stop playing the intermarket volatility game, you should at least incorporate that information into your market outlook.

DISCLAIMER: "VIX®" is a trademark of Chicago Board Options Exchange, Incorporated. Chicago Board Options Exchange, Incorporated is not affiliated with this website or this website's owner's or operators. CBOE assumes no responsibility for the accuracy or completeness or any other aspect of any content posted on this website by its operator or any third party. All content on this site is provided for informational and entertainment purposes only and is not intended as advice to buy or sell any securities. Stocks are difficult to trade; options are even harder. When it comes to VIX derivatives, don't fall into the trap of thinking that just because you can ride a horse, you can ride an alligator. Please do your own homework and accept full responsibility for any investment decisions you make. No content on this site can be used for commercial purposes without the prior written permission of the author. Copyright © 2007-2023 Bill Luby. All rights reserved.
 
Web Analytics