Showing posts with label Dow Jones World Stock Index. Show all posts

Tuesday, February 24, 2009

Germany and China Faring Relatively Well in Downturn

With the SPX perched precariously above its November low and pundits monitoring the vital signs around the clock, coverage of the stock markets in the U.S. has once again taken on a very Americentric tone. For the most part, focusing on the U.S. financial system and the U.S. economy makes sense. One of the many lessons to come out of the current financial crisis, however, is the end of the decoupling myth. In fact, we are all butterflies flapping our wings on a global stage now.

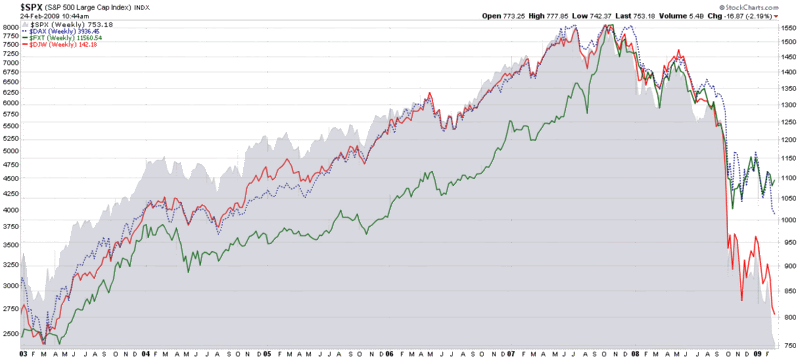
As always, some countries are faring better than others. The chart of the Nikkei 225 looks sufficiently like that of the SPX that I elected to omit it from the graphic below. Instead, I have chosen to compare the stock market indices of the world’s third and fourth largest economies, China (FXT, the index that forms the basis of the popular ETF, FXI) and Germany (DAX), in the context of the S&P 500 and the Dow Jones World Stock Index (DJW).

Note that relative to the October/November lows, China has shown a distinct pattern of making higher lows – in sharp contrast to U.S. and global indices. Germany has also shown considerable resiliency. Even though the DAX is now trading below its November low, Germany stocks have outperformed their global counterparts.

Scrolling back to 2003, I find it interesting that both China and Germany still are well above their 2003 lows, while the Dow Jones World Stock Index is now only about 5% above the lows from that bear market.

So while most investors are currently focusing their attention on the Dow Jones Industrial Average, the S&P 500, the NASDAQ indices and the Russell 2000, support levels and trends in key international indices may hold equally important clues about global buying and selling patterns – and the possibility of finding a bottom.
[source: StockCharts]
Monday, February 2, 2009

Bullish Signal from Global Volatility Index

VIX and More’s proprietary Global Volatility Index has been a big hit since I unveiled it in November, which means that I will periodically update it and flag interesting developments in this space going forward.

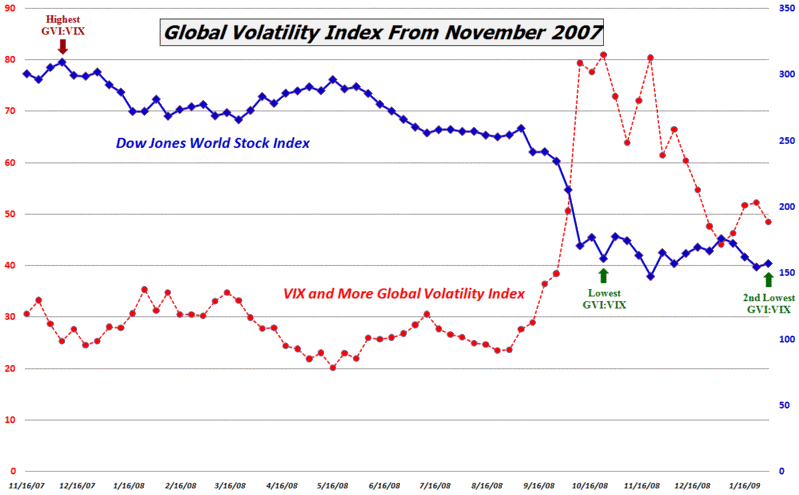
At the close of Friday’s session, the difference between the Global Volatility Index and the VIX had narrowed to its lowest level since October and the premium percentage (the GVI divided by the VIX) was at its second lowest level ever. I consider this to be a bullish signal.

In the chart below, I have marked the previous highs and lows in the premium percentage with red and green arrows. The red arrow marking the high comes from the first week in December 2007 and was an excellent opportunity to sell or get short. The green arrow from late October was an early bottom. In the months that have followed, the Dow Jones World Stock Index has largely marked time. While this indicator is still relatively young and untested, I consider Friday’s second lowest reading to reinforce or confirm the October buy signal.

As always, caveat emptor.

[source: VIX and More]

Sunday, January 4, 2009

The Year in Global Volatility (2008)

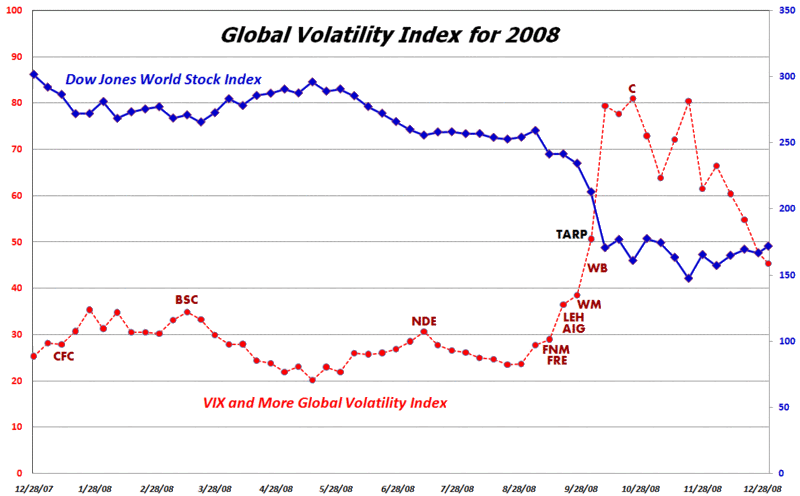
In November I launched the VIX and More Global Volatility Index, which is a weighted average of the implied volatility in options for equities in the 15 largest global economies. I will have more to say about the Global Volatility Index in 2009, but want to use this occasion to highlight the index as a means of tracking the rise of volatility in response to major volatility events during the course of the past year. In addition to the Global Volatility Index (shown in red), the chart below captures the Dow Jones World Stock Index (blue), as well as the signing of the TARP legislation (black) and the tickers (dark red) for some of the major financial companies that failed and/or were rescued by the U.S. government.

[source: VIX and More]

Saturday, November 15, 2008

Introducing the VIX and More Global Volatility Index

As representatives of the G20 assemble in Washington to discuss the state of the global economy, this seems like a good time to take the wraps off of the VIX and More Global Volatility Index.

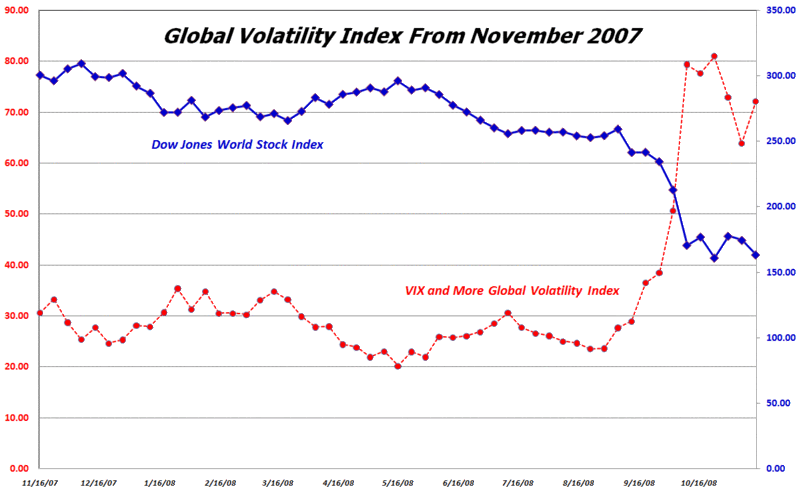
Without getting into all the details, the Global Volatility Index calculates a weighted average of the implied volatility in options for equities in the 15 largest global economies, which represent approximately 76% of the world’s economic activity.

To the best of my knowledge, this index is the first of its kind, with previous volatility indices limited to country-specific volatility or in the case of the VSTOXX, to the Eurozone area.

The chart below plots the Global Volatility Index against the Dow Jones World Stock Index over the course of the past year. The Global Volatility Index opens up many new areas of analysis and interpretation of the markets and I will talk more about these in this space in the coming weeks.

[source: VIX and More]

DISCLAIMER: "VIX®" is a trademark of Chicago Board Options Exchange, Incorporated. Chicago Board Options Exchange, Incorporated is not affiliated with this website or this website's owner's or operators. CBOE assumes no responsibility for the accuracy or completeness or any other aspect of any content posted on this website by its operator or any third party. All content on this site is provided for informational and entertainment purposes only and is not intended as advice to buy or sell any securities. Stocks are difficult to trade; options are even harder. When it comes to VIX derivatives, don't fall into the trap of thinking that just because you can ride a horse, you can ride an alligator. Please do your own homework and accept full responsibility for any investment decisions you make. No content on this site can be used for commercial purposes without the prior written permission of the author. Copyright © 2007-2023 Bill Luby. All rights reserved.
 
Web Analytics