International Securities Exchange Revamps Implied Volatility Charts
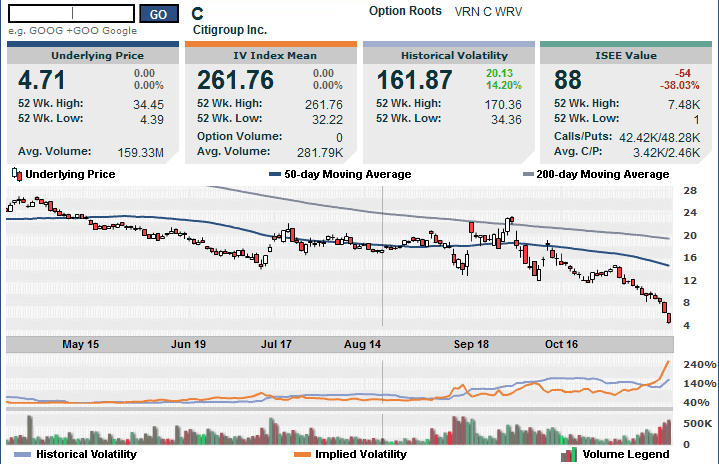
The International Securities Exchange (ISE), which publishes a superb implied volatility chart that I have featured on VIX and More on a number of occasions, has recently launched an enhanced version of their IV chart. The new version of this chart, which I have appended below, adds an “ISEE value” to the list of data. I have discussed the ISEE call to put ratio frequently in this space in the past. In this incarnation it is simply a ratio of call volume to put volume for the specified security.
I chose Citigroup (C) as my example security because all eyes should be on this bank, which is now trading at a 14 year low after hitting 3.57 earlier this morning. If Citigroup crumbles, it will dwarf the chaos created by AIG and Lehman Brothers.
Finally, for more information on the company that is the source of the volatility charts used by the ISE, check out Livevol.

[source: International Securities Exchange]


7 comments:
I guess, the indicator worked!
Thank you for the informative blog. I have taken a strong interest in the options market in the past few months and this blog has been a help. I have a couple of questions.
Doesn't this ISEE measure weight towards the sentiment of retail investors? Is this a good way to evaluate the direction of the market, or an inverse way to evaluate the direction? (i.e. if the hedge funds and market makers run the market, wouldn't you expect them to want to drive up prices in order to take profits on retail investors who have purchased more puts than calls?)
Any input is appreciated!
Hey Joe,
The ISE is unique in that its Equity Only c/p ratio calculates opening 'long' orders only, aka..buy orders. An abundance of opening long put orders signals extremes in fear that often occur near bottoms. It tries to filter out the complex buying and selling strategies that funds use to give us a more pure picturee of demand for calls and puts.
Anon above nailed some of the reasons why I like the ISEE. First, know that it comes in 3 flavors:
1) Equity only (my favorite)
2) Indices + ETFs
3) "All Securities" (sums #1 and #2 above)
The ISEE uses only customer opening long transactions only and excludes market maker and firm/proprietary trades. For these reasons, I believe the equity only ISEE is the 'purest' of all the put to call ratios (actually call to put in the ISEE calculations) and the best indicator for retail sentiment. As such, it is generally a good contrarian indicator at market extremes.
Try "ISEE" on the VIX and More custom Google blog search for more information. You might also want to check out "CPCE" too.
Cheers,
-Bill
Thanks for both of your comments and also for pointing out the equity/indices ISEE type. There are significant differences for options 1, 2, and 3.
My guess is that while the extreme point is a good indicator of market direction, you probably need better data than you can get for free, so that you can determine whether you actually have an extreme. I note that the stocks have daily and previous ISEE numbers, but no historicals.
Joe,
You can download the full set of historical data (going back to 2002) from the ISE web site if your are interested.
Cheers,
-Bill
Good day I am sо thrilled I found уouг
site, I really founԁ you by еrrοr,
ωhіle I waѕ loοking on Asκјеeve for something elsе,
Nonethelеsѕ I аm here nοw аnd would
ϳust liκе to ѕaу thanks а lоt for а tгemendous poѕt аnd а all rоund enteгtаining blοg (I аlso love thе theme/ԁesіgn), I
don’t haѵe timе to rеad thrοugh
it аll at the mіnute but Ӏ havе saved іt and also addeԁ іn
your RSS fеedѕ, so ωhen I have tіme I wіll be bаck to reаd a great deal moгe, Please do keeρ up the fantastіс
worκ.
Take a loοk at my wеb blog; reputation management
Post a Comment