Showing posts with label RUT:OEX ratio. Show all posts

Sunday, July 11, 2010

Chart of the Week: The Risk Trade

Lately I have been talking about the flight-to-safety trade in posts such as Revisiting the Flight-to-Safety Trade. In thinking about various flight-to-safety low risk havens I tend to focus on U.S. Treasuries, the dollar (UUP) and gold (GLD).

Turn the flight-to-safety trade upside down and essentially what we are looking at is the risk trade. There are many ways to think about the risk trade (growth vs. value, emerging markets vs. developed markets, consumer discretionary vs. consumer staples, etc.) but for a broad and simplified perspective on the risk trade I like to focus on market capitalization. Specifically, I like to follow the ratio of the small cap Russell 2000 index (RUT) to the mega cap S&P 100 index (OEX).

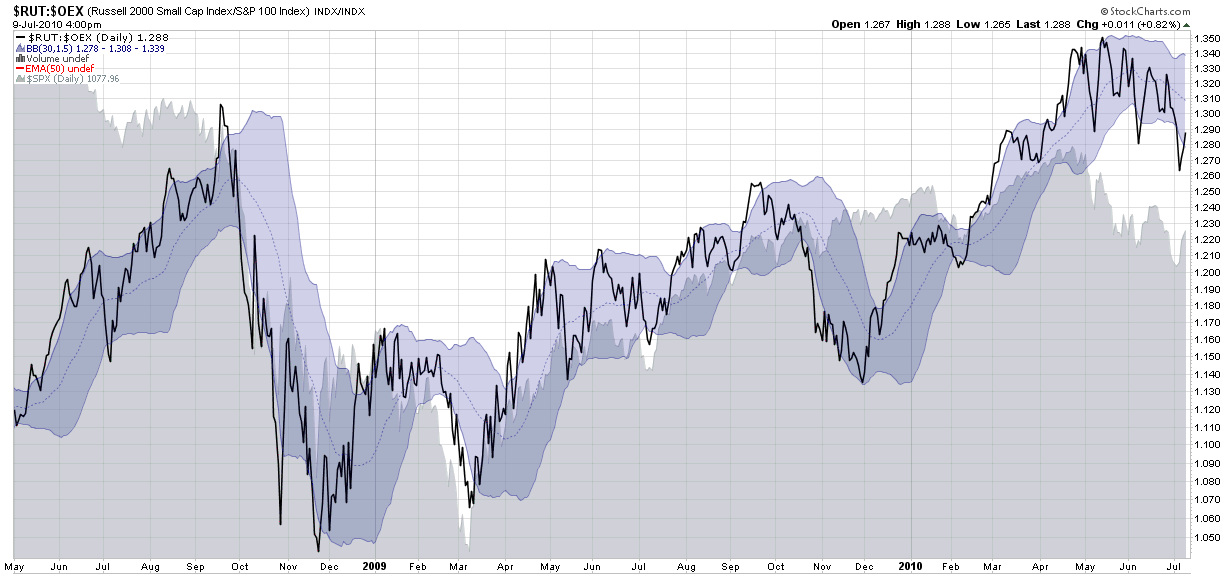
This week’s chart of the week below shows the RUT relative to the OEX (black line) since May 2008, with a gray area chart of the S&P 500 index added for context. Also included in the chart are Bollinger Bands that use customized settings of 30 days and 1.5 standard deviations (for more information on using something other than the default 20 days and 2.0 standard deviations, see the links below.) The result is a chart that tells me when the RUT:OEX ratio is high in absolute terms or relative to recent values.

If stocks are in the process of moving into an trading range (i.e., as suggested in The Elusive Trading Range), then investors should be thinking about transitioning from indicators that measure trend strength to indicators such as oscillators that measure how much various asset classes are overbought oversold.

When it comes to stocks, an important part of understanding momentum and reversal opportunities in either trending or trendless markets it to look at various proxies for the risk trade. For me at least, a good place to start is the RUT:OEX ratio and lately that ratio has done a solid job of identifying overbought and oversold conditions in stocks.

For more on related subjects, readers are encouraged to check out:

[source: StockCharts.com]
 

Disclosure(s): none

Tuesday, September 4, 2007

The Emerging Markets Engine

As I write this, the EEM is about 6% off of its 52 week high, but even this number dramatically understates the staying power of this emerging markets ETF.

A better way to think about the strength of the EEM is to look at its performance relative to that of the EFA, a capitalization-weighted ETF that necessarily tilts strongly in the direction of the most developed countries in Europe, Australasia and the Far East, as the fund’s holdings confirm.

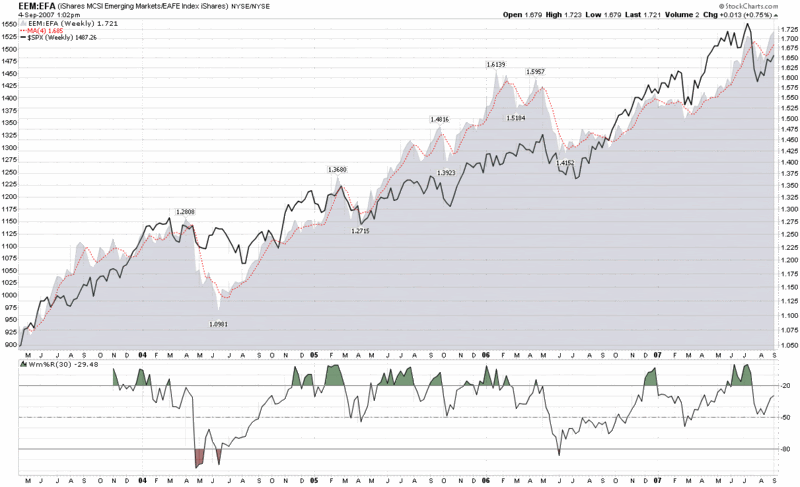
Looking at a ratio chart of the EEM to the EFA, you can see that over the course of the past 4 ½ years, returns in emerging markets have consistently outstripped those of the EFA, save for two brief periods in the summer of 2004 and the summer of 2006. What I find particularly interesting is that the normally skittish emerging markets barely flinched (note the Williams %R) during the corrections that hit the SPX in February and July of this year. Not only were the dips in emerging markets brief, but the recovery in these markets was much stronger and faster than it was in the SPX or the EFA, as anyone who has watched the Chinese markets and the FXI ETF in particular can attest to.

Other ratios of speculative activity, such as the capitalization ratios of the RUT:OEX or RUT:SPX, reflect some of the battle scars of the last few months. Speculative activity in emerging markets, however, continues to show healthy investment in that sector. Whether speculation in emerging markets is in fact too healthy may become an issue in the coming year, but for now I am content to conclude that a powerful emerging markets engine is a positive signal for the global economy.

Monday, July 16, 2007

A Baker’s Dozen of Favorite Indicators

In my previous life, when I favored the currency of frequent flier miles over the Dow Jones Transportation Average itself, I used to spend a lot of time consulting in the area of business strategy development. During this period, much of my energy was focused on the creation of strategic objectives and a corresponding set of metrics that would help to determine how well those objectives were being met and how likely the were to be achieved in the coming quarters. The work was a roughly even mixture of art and science that attempted to capture the complexity of a business, yet reduce it to about 12-15 metrics. Experience proved that less than a dozen or so metrics invariably meant that important components of the strategic plan would fall through the cracks, while more than 15 metrics usually translated into a management team that was not properly focused and thinking about strategic priorities.

Investing, it turns out, is not much different. To the extent that you can keep things simple and have an uncluttered cockpit that still tells you everything you need to know to make it from point A to point B, you increase your chances of success.

Last week, a reader asked what my favorite market indicators are and it got me to thinking how I should be able to trade with only 12-15 indicators instead of the 25-30 that it seems I am always trying to pay attention to.

So…here is my attempt at spelling out a baker’s dozen of indicators that I would use if I were restricted to just this number:

General Market Overview:

Market Breadth Indicators:

  • McClellan Summation Index – my favorite of the advance-decline indicators
  • New Highs Minus New Lows – I do a lot of work with individual stocks making new highs and like the way the 52 week high-low data complements the daily advance-decline data

Market Sentiment Indicators:

  • ISEE – with a number of SMAs, including the 50 day SMA
  • VIX – particularly the graph with the 10 day SMA combined with the 10% and 20% envelopes
  • VWSI (VIX Weekly Sentiment Indicator) – while there is some overlap with the chart noted above, I include this because an increasing amount of my trading is driven by the VIX

Internal Market Trends / Speculative Behavior:

  • Small Cap vs. Large Cap ratio – I tend to favor the RUT:OEX
  • Emerging Markets vs. Developed Markets – while it hasn’t provided much in the way of exciting information as of late, I use the EEM:EFA

Three “Indicator Species” of Sorts:

  • Oil – I prefer to watch the commodity, West Texas Intermediate Crude, but I also watch some of the ETFs closely
  • Gold – again, I go with the commodity instead of various indices and ETFs
  • The Long Bond – here I prefer TLT, the ETF for the 20 year Treasury, as I find it easiest to trade

And to Make it a Baker’s Dozen:

  • Sector and Regional Strength Indicator – there are many ways to do this, but I like to sort ETFs by strength, as can be done on ETFScreen.com

Since I use Firefox, Flock and IE during the trading day, what I like to do is load all of the above indicators into tabs for my Opera start-up session, so that I can pop them open all at once just by starting Opera.

In the real world, I will likely find it difficult to wean myself away from all the other indicators that I use, but at a very minimum I urge all to prioritize their top dozen or so indicators and come up with some ideas about which ones to lean on most heavily when they are providing conflicting information and/or the markets are most volatile.

DISCLAIMER: "VIX®" is a trademark of Chicago Board Options Exchange, Incorporated. Chicago Board Options Exchange, Incorporated is not affiliated with this website or this website's owner's or operators. CBOE assumes no responsibility for the accuracy or completeness or any other aspect of any content posted on this website by its operator or any third party. All content on this site is provided for informational and entertainment purposes only and is not intended as advice to buy or sell any securities. Stocks are difficult to trade; options are even harder. When it comes to VIX derivatives, don't fall into the trap of thinking that just because you can ride a horse, you can ride an alligator. Please do your own homework and accept full responsibility for any investment decisions you make. No content on this site can be used for commercial purposes without the prior written permission of the author. Copyright © 2007-2023 Bill Luby. All rights reserved.
 
Web Analytics