Showing posts with label OEX. Show all posts

Sunday, July 11, 2010

Chart of the Week: The Risk Trade

Lately I have been talking about the flight-to-safety trade in posts such as Revisiting the Flight-to-Safety Trade. In thinking about various flight-to-safety low risk havens I tend to focus on U.S. Treasuries, the dollar (UUP) and gold (GLD).

Turn the flight-to-safety trade upside down and essentially what we are looking at is the risk trade. There are many ways to think about the risk trade (growth vs. value, emerging markets vs. developed markets, consumer discretionary vs. consumer staples, etc.) but for a broad and simplified perspective on the risk trade I like to focus on market capitalization. Specifically, I like to follow the ratio of the small cap Russell 2000 index (RUT) to the mega cap S&P 100 index (OEX).

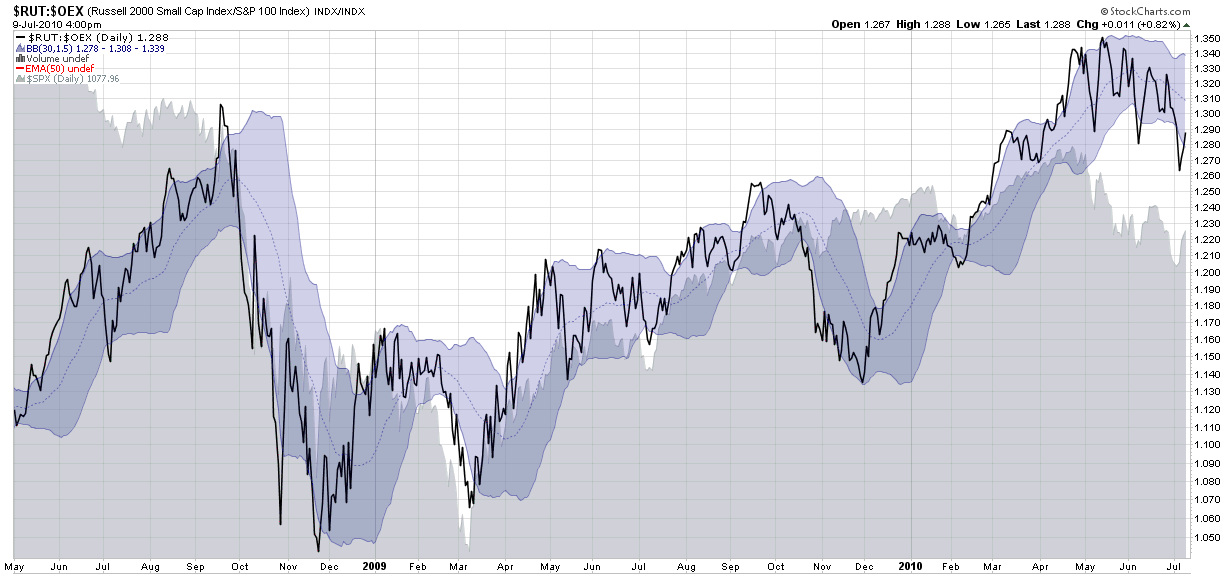
This week’s chart of the week below shows the RUT relative to the OEX (black line) since May 2008, with a gray area chart of the S&P 500 index added for context. Also included in the chart are Bollinger Bands that use customized settings of 30 days and 1.5 standard deviations (for more information on using something other than the default 20 days and 2.0 standard deviations, see the links below.) The result is a chart that tells me when the RUT:OEX ratio is high in absolute terms or relative to recent values.

If stocks are in the process of moving into an trading range (i.e., as suggested in The Elusive Trading Range), then investors should be thinking about transitioning from indicators that measure trend strength to indicators such as oscillators that measure how much various asset classes are overbought oversold.

When it comes to stocks, an important part of understanding momentum and reversal opportunities in either trending or trendless markets it to look at various proxies for the risk trade. For me at least, a good place to start is the RUT:OEX ratio and lately that ratio has done a solid job of identifying overbought and oversold conditions in stocks.

For more on related subjects, readers are encouraged to check out:

[source: StockCharts.com]
 

Disclosure(s): none

Thursday, May 3, 2007

Capitalization and Bullishness

An unusual aspect of the post-2/27 rebound in the markets has been the ascendancy of large cap stocks over smaller capitalization ones. While there have been many periods in which large caps have outperformed small caps, in our current 4 ½ year bull market, this has never coincided with a dramatic up leg in the S&P 500, as the ratio chart for the Russell 2000 and the S&P 100 demonstrates below (click for a larger image):

If you turn back the clock to the 1990s, however, you discover that there is an important precedent for large cap outperformance leading the broader markets up. Specifically, the period of 1995-1999 saw the OEX dramatically outperform the RUT in relative terms, dragging the broader markets through a bull run that none of us will ever forget.

The 1995-1999 period is also a very interesting one from a VIX perspective (yes, it’s always about the VIX, isn’t it?) because it coincides with the one long-term bull market in which volatility and stocks moved up hand in hand, as I discussed at some length two weeks ago in “The SPX and the VIX Revisited.” (Incidentally, given the strong response to that post, I have moved it to the select “Archive Highlights” section in the right hand column of the blog.)

With every ‘discovery’ comes more questions and the question this observation has raised for me is the relationship between volatility and the relative performance of different capitalization groups. Stay tuned…

DISCLAIMER: "VIX®" is a trademark of Chicago Board Options Exchange, Incorporated. Chicago Board Options Exchange, Incorporated is not affiliated with this website or this website's owner's or operators. CBOE assumes no responsibility for the accuracy or completeness or any other aspect of any content posted on this website by its operator or any third party. All content on this site is provided for informational and entertainment purposes only and is not intended as advice to buy or sell any securities. Stocks are difficult to trade; options are even harder. When it comes to VIX derivatives, don't fall into the trap of thinking that just because you can ride a horse, you can ride an alligator. Please do your own homework and accept full responsibility for any investment decisions you make. No content on this site can be used for commercial purposes without the prior written permission of the author. Copyright © 2007-2023 Bill Luby. All rights reserved.
 
Web Analytics