Showing posts with label AMZN. Show all posts

Thursday, October 31, 2013

Halloween Monsters

In the spirit of the day and lacking the resources and imagination to do something as elaborate as the Guillermo del Toro couch intro for the 2013 Treehouse of Horrors episode of The Simpsons (definitely worth a click through) I have elected instead to construct a portfolio of what I am calling the Halloween Monsters – a group of ten stocks that have been absolutely killing it this year, leading the markets higher.

The list includes the following familiar momentum names:

I intentionally left off Google (GOOG), in spite of an excellent 2013, largely because this behemoth now has a $346 billion market capitalization and there are some limits on how quickly on organization this size can grow.

With the inclusion of Baidu, the list reminded me a little of something I did back in October 2007, when I sensed a little too much froth in the stock market and created something I called the OHFdex, which began as a “watch list of Overripe High Fliers” and quickly evolved into an index designed to track 14 such stocks. When the markets turned down, the group was pummeled, with some spectacular crashes from the likes of CROCS (CROX), Las Vegas Sands (LVS), DryShips (DRYS) and others.

The current list is certainly filled with high fliers, but whether they are overripe or capable of soaring higher is not as obvious as it was in October 2007 – at least for me. For that reason, I will keep a close eye on the Halloween Monsters portfolio going forward, as their movements will likely be a tip off as to where the broader markets are headed.

[source(s): Finviz.com]

At the very least, I expect the stocks on this list to offer some interesting fodder for the archives, just as the OHFdex did in 2007 and 2008. Who knows, perhaps the next iteration of the OHFdex is just around the corner.

For more on the OHFdex and similar flights of fancy, check out the links below.

Related posts:

Disclosure(s): none

Thursday, May 10, 2012

Looks Like Apple VIX (VXAPL) Futures Are Coming Soon

In case anyone missed it, I wanted to highlight a report yesterday from Reuters which quoted  Edward Tilly, President of CBOE Holdings, as saying that not only is the VIX product line ripe for expansion, but:

“We have benchmarks on a number of other products. I would point out one that is a favorite of mine that I wouldn't be surprised if I saw us launch in the near future - futures on Apple VIX.”

The Apple VIX (VXAPL) was launched in January 2011 along with similar single stock volatility indices for the following:

  • Amazon (AMZN): volatility ticker: VXAZN
  • Google (GOOG): volatility ticker: VXGOG
  • Goldman Sachs (GS): volatility ticker: VXGS
  • IBM (IBM): volatility ticker: VXIBM

A successful launch of futures on VXAPL might open the door for futures on one or more of the other single stock volatility indices above.

The chart below, courtesy of Livevol (StockCharts.com, you really should have VXAPL in your database) shows that VXAPL has tended to remain in the mid-30s, but has ranged between the high teens to the high 50s in the first 17 months of its life.

Recall that the CBOE Futures Exchange (CFE) launched futures on the emerging markets volatility index (VXEEM) in December 2011 and followed up by launching options on VXEEM at the end of January. The CFE also launched futures based on VXEWZ (CBOE Brazil ETF Volatility Index, which is based on EWZ) on February 21 and added options to VXEWZ on March 6.

If you enjoy trading volatility products, it looks like we may be entering the golden era of shrink-wrapped volatility indices, which can serve as a product platform for futures, options and even exchange-traded products. If you think VIX-based ETPs are fun, just wait until a VXAPL-based ETP is rolled out. Of course, if there is not enough demand for the futures and options, some of these ETPs may never see the light of day, so early adopters, don’t shy about hitting some of those bids.

Finally, on a somewhat tangential note, I think I received more emails on The Case for Selling Apple Puts than on any other post in the history of VIX and More. To all those who wrote, including those who elected to sell Apple (AAPL) puts, the current environment may be suitable for a revisiting this trading strategy.

Related posts:

[source(s): LivevolPro.com]

Disclosure(s): long AAPL at time of writing; Livevol and the CBOE are advertisers on VIX and More

Friday, April 27, 2012

Weekly Options Coming on Strong

When the CBOE made a push to expand interest in weekly options about two years ago, their efforts were initially met with a fair degree of skepticism. Over time, however, weekly options have found a dedicated following, with the CBOE “weeklys” growing from 1% of total volume to about 15% today. Two years ago there were a handful of index weeklys, as well as a handful of weekly options based on ETPs and individual stocks. The list of weekly options changes every week, but the current list for weeklys expiring on May 4th now includes options on six indexes, 26 ETPs and 119 individual stocks. What was once a curiosity is now a groundswell.

Personally, I have found quite a few uses for weekly options. On Tuesday, for instance, I tweeted that the VXX 18/19 call spreads had the same price for the weekly options as next month’s standard May 19th expiration.

Part of the appeal of the weeklys can be seen in the graphic below of the skew in Amazon (AMZN), where today’s April 27th weeklys (red line) have a huge implied volatility (and therefore price) premium to their counterparts with more distant maturities. Looking at the graphic, one can see that it is not that difficult to construct positions with weekly options (which also include the May 4th options, shown with a yellow line) in which one leg has implied volatility that is 50-100% higher than another leg. If you have a bias toward selling options, as I do, this can sometimes offer up an irresistible mathematical edge.

Lately when I find myself editing my various watch lists, one of the first things I check for is whether the underlying in question has weekly options. If you have weeklys, you are in the big leagues and there are so many more trading opportunities. With ZNGA weekly options being added this week, for instance, the ease and flexibility of trading this issue around yesterday’s earnings report was dramatically improved.

If you haven’t tried weeklys yet, you are missing out. And if you think the volumes are too small and the markets are too thin, think again.

[Note that an excellent source of information for all things related to weekly options is the CBOE Weeklys splash page.]

Related posts:

[source(s): LivevolPro.com]

Disclosure(s): short VXX and ZNGA at time of writing; Livevol is an advertiser on VIX and More

Tuesday, January 31, 2012

CBOE Adds Options to Emerging Markets Volatility Index (VXEEM)

Earlier this month, the CBOE launched futures on the CBOE Emerging Markets ETF Volatility Index (VXEEM) and barely three weeks later, VXEEM options began trading today.

For more information on VXEEM options, which are based on the popular EEM emerging markets ETF, a good first stop is the CBOE’s VXEEM options product specification page. Of particular note is the fact the options expiration cycle is the same for VXEEM options as it is for the futures products. Additionally, VXEEM futures and options have the same expiration cycle as VIX futures and options, meaning that they will expire on Wednesdays (February 15, March 21, April 18 and May 16), with the options last traded on the Tuesday immediately following the expiration. For more information, check out the CBOE’s VXEEM splash page and information circular.

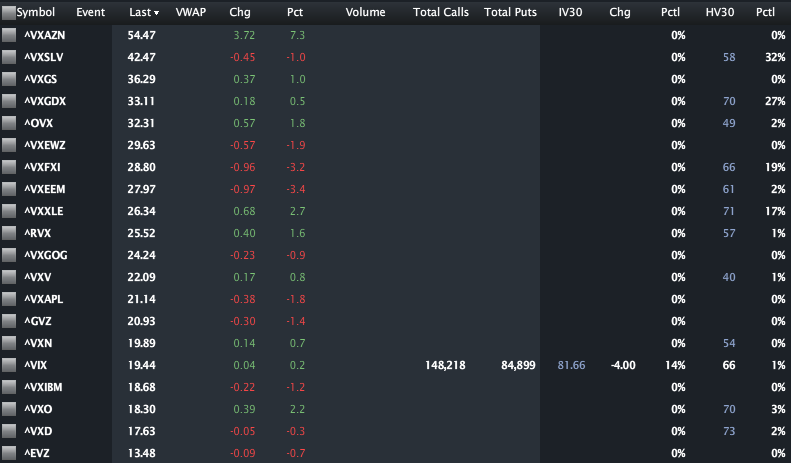
In the graphic below, courtesy of LivevolPro.com, I have collected closing data for some of the primary U.S. volatility indices, including those which are volatility indices for ETPs and single stocks. The indices are sorted from highest to lowest and provide a good sense of the market’s perceptions of relative risk across various stocks, groups of stocks (sectors and geographies) and asset classes.

Partly due to today’s earnings announcement, VXAZN, the volatility index for Amazon (AMZN) tops the list, with volatility indices for silver (VXSLV), Goldman Sachs (VXGS) and gold miners (VXGDX) rounding out the top four. VXEEM ranks eighth of the twenty volatility indices at 27.97 and currently carries a 43.8% premium to the VIX. Is that 43.8% premium too high? Too low? With VXEEM options (and futures) now you can not only express your opinion, but benefit financially if you are correct.

Related posts:

[source(s): LivevolPro.com]

Disclosure(s): Livevol is an advertiser on VIX and More

Wednesday, January 5, 2011

CBOE to Publish VIX-Style Volatility Indices for Individual Stocks

The volatility space continues to expand in the direction of the atomic level, with today’s announcement by the Chicago Board Options Exchange (CBOE) that it will begin disseminating implied volatility data utilizing the VIX calculation methodology for five stocks as of Friday, January 7th.

The five stocks are:

My initial thought include some of the following:
  • It will be interesting to see how much divergence there will be between the CBOE NASDAQ 100 Volatility Index (VXN) and the volatility indices for some of the key components of the NASDAQ-100 index, notably Apple, Google and Amazon
  • A Goldman Sachs volatility index will be particularly useful in terms of financial crisis
  • IBM is an interesting choice for a fifth wheel here, as IBM does not have the same bellwether status that it once did
  • Finally, first with weekly options and now with volatility indices for individual stocks, the CBOE has managed to shorten the scope of volatility analysis both at the issue level and in terms of the time frame. I’m calling this the march toward atomic volatility.
Related posts:
Disclosure(s): the CBOE is an advertiser on VIX and More

Friday, January 23, 2009

Four Horsemen of Technology Running Strong Again?

In this market, I find it hard to think of any stock as ‘running strong’ unless they are in the precious metals business, but strong can also be a relative term.

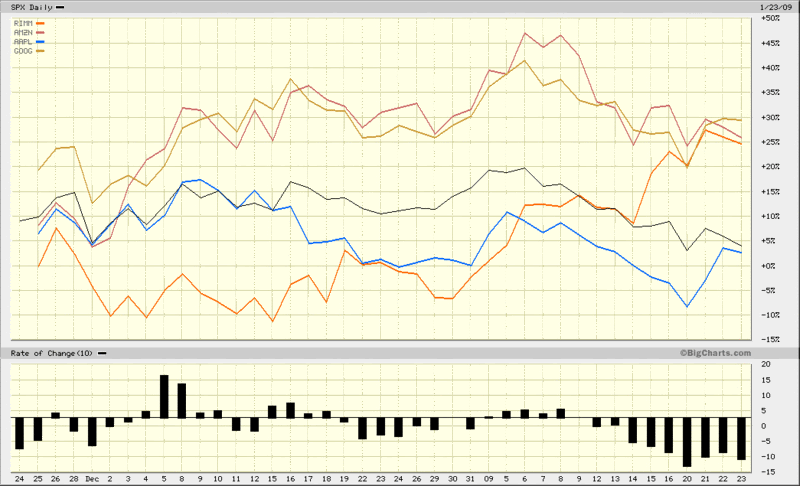
Some stocks have held up better than others – and even shown considerable buying interest – over the course of the past few weeks and months. Four which stand out from the past are the so-called Four Horsemen of Technology: Research in Motion (RIMM); Amazon (AMZN); Google (GOOG); and Apple (AAPL).

All four of these large cap tech generals have recently provided a positive earnings surprise, with the most recent surprise coming with Google yesterday afternoon. Had it not been for the Steve Jobs health issue, all four stocks would be crushing the S&P 500 index over the course of the past two months highlighted in the chart below. In fact, even with the Jobs issue, Apple is relatively even with the broad market index.

Investors are wondering which stocks will provide leadership in the next bull leg. My guess is that the next group of leaders will include one or more of these tech titans.


[source: BigCharts]

Disclosure: Long GOOG at time of writing.

Wednesday, October 24, 2007

Four Generals Will Tell the Story

I am a big fan of market breadth indicators, but when considering whether or not the markets may be at a turning point, I prefer to focus on a handful of leaders rather several thousand small caps whose fortune is never to make it to CNBC’s scrolling ticker. Jeopardy may have “foods that begin with the letter Q” (one of my favorite movie scenes, for reasons I’m still not entirely sure of), but somehow I don’t think we’ll ever hear, “I’ll take micro-cap tickers for $200, Alex.”

Cramer has his “Four Horsemen of Technology” (RIMM, AMZN, GOOG, and AAPL), but this sector focus, while important, is a little too restrictive for my liking. I do think, however, that it is possible to get some meaningful information from watching only four stocks.

Right now, four areas of the economy that I am watching most closely are China, technology, global trade, and consumer spending. These areas just happen to coincide with four stocks that have been market leaders over the past few months, are current or recent members of my OHFdex (Overripe High Fliers Index), have recently made new highs, and probably need to continue to make new highs for this market to continue to the bull march.

In order of recent price strength, the four generals I am focusing on are Apple (AAPL), Baidu (BIDU), Southern Copper (PCU), and MasterCard (MA). Interestingly enough, it is possible that each of these stocks has already made an intermediate-term top. Apple has been the strongest of the group, but following an impressive earnings report on Monday evening, the stock gapped up and has slowly been drifting down since then. It would be hard to proclaim a top in AAPL right now, but the short-term momentum appears to have left the stock. Baidu’s earnings are tomorrow, but the high of October 11th is already starting to look like a possible top, as BIDU trades about 30 points below that high at the moment. Southern Copper has also been drifting down since an October 11th high; yesterday’s earnings report has done nothing to change the trend. Lastly, MasterCard’s high water mark dates from July 13th. The company has been a consistently impressive performer since it’s May 2006 IPO, during which time it has quadrupled in price. For the past three months the action has been mostly sideways, with the stock rising and falling over concerns about the impact of the credit crisis on retail spending.

My personal belief is that all four stocks will continue to come under pressure as the markets grapple with the possibility that the October 11th highs will be hard to take out. I am not a kiss and tell trader and I prefer not to talk about my trading and positions, but since many have asked, at present I am short all four generals, though I will not be short BIDU when it reports earnings tomorrow. For the record, anything less than a blowout quarter and BIDU could be the catalyst that turns the current small market correction into some longer term bearishness.

Now it’s your turn, readers. If you could only follow four individual stocks to divine the direction of the market, which stocks would those be?

Tuesday, July 24, 2007

VIX Has More Room to Run

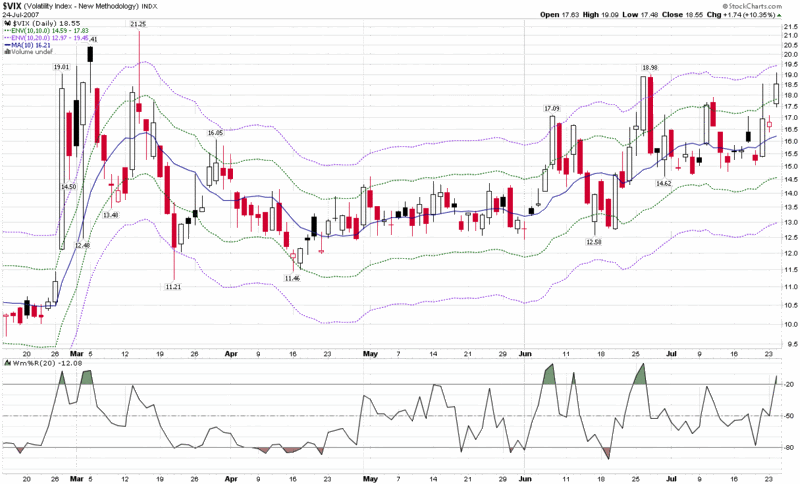
Thanks in part to a strong earnings report from Amazon (AMZN), the VIX dropped back to 18.55 by the time of its 4:15 ET close, down from an intra-day high of 19.09.

How high will the VIX go from here?

Turning to the VWSI, I note that it closed at -3 today, indicating that there is still a fair amount of room for the VIX to run without getting overextended. For the VWSI to reach -6 tomorrow – the point at which I generally look to fade the move with options – the VIX will have to touch 19.26. Also consider that a VWSI of -8 requires that the VIX hit 19.46 tomorrow; the maximum reading of a VWSI of -10 would result from a VIX of 21.21. So, if it turns out that today’s 19.09 is not a near-term high in the VIX, I would expect to see the VIX topping out in the 19.50 – 21.50 range. (Note that all VWSI numbers are reset at the end of each day, so these thresholds are moving targets and will be lifted higher by a gradually trending VIX.)

One way to illustrate the moving target aspect of the VMSI is to look at the VIX’s somewhat analogous moving average envelopes. Shown below are the 10% (dotted green line) and 20% (dotted purple line) moving average envelopes that surround the VIX’s 10 SMA (solid blue line.) As the VIX has trended upward over the past three months, the moving average envelopes have risen with it, so while the 17.08 and 18.98 VIX spikes in early and late June look like breakouts that are highly susceptible to the gravitational pull of mean reversion, today’s runup to 19.09 looks much more like normal oscillation around an uptrending mean.

Of course the VIX should not be the only tool in your toolbox. When I look at put to call ratios, new highs and new lows, as well as other market sentiment data, the case for the VIX topping out soon looks fairly strong to me.

Friday, April 27, 2007

CNBC Million Dollar Portfolio Challenge: #1280

You would think that a nice 2.2% gain (thank you GSIC) in addition to maxing out on the $3000 ‘bonus bucks’ trivia winnings would have served me well on a day in which the markets were essentially flat. That was not the case yesterday, as the AMZN bus rolled past me – just like the BIDU bus has done today – and I ended up dropping 20 places to #1280. One of these days, I need to catch a ride on that bus…

Thanks to these gains, my portfolio was up to $1.73 million coming in to the trading day, still good enough to keep me in the top 0.1% of the 1,382,297 contestants. It looks like I could be moving up a little today, perhaps even in to the top 1000, as I have all my chips on NetLogic Microsystems (NETL), whose positive earnings report has the stock up 7% at the moment, down from a 14% advance earlier this morning.

On the horn front, if old mono recordings of Dennis Brain are not your thing, try the more modern recordings of Barry Tuckwell. As luck would have it, he is responsible for what may be the second best recording of the Mozart Horn Concertos, but one that benefits from 1990 recording technology. In addition to the Mozart works, there are many other excellent Tuckwell recordings to choose from, including The Art of Barry Tuckwell, which is pictured at the right.

Thursday, April 26, 2007

CNBC Million Dollar Portfolio Challenge: Top 0.1%

OK, so I didn’t buy Amazon (AMZN) before their earnings report and missed an opportunity to log an ‘easy’ 27% gain yesterday. I still made up some ground, however, with a more than respectable 2.9% gain in VECO.

My portfolio is now up to $1.69 million, but with tenth place in the CNBC Million Dollar Portfolio Challenge at $2.93 million, the task ahead continues to be a formidable one. On the plus side, at #1260 out of 1,324,502 contestants, I can at least claim to have made it into the top 0.1%.

As this contest has progressed I have discovered the need for an earnings spike potential algorithm and have spent some time testing and refining such a beast. Yesterday, before the close, it kicked out three companies with a high potential to spike after they reported earnings after hours. The good news is that the algorithm (which I will be glad to talk about after this contest is over) produced three highly volatile plays for today: SWKS (up 21% a little after noon EDT); HLIT (down 15%); and ARBA (down 9%.) Of the three, I looked hardest at SWKS and ended up passing on this one, as well as the other two. The potential for volatility was certainly there, but I was concerned that it was more likely toe be in the wrong direction. Instead, I went with a slightly less volatile play that has been showing a lot more momentum in the run up to earnings: GSI Commerce (GSIC), whose retail e-commerce solutions helped deliver a quarter that was good enough to overcome two analyst downgrades that knocked the stock down early this morning. After opening down 5.3% this morning, the stock has rallied to where it is currently trading up 4% on the day.

And now for the horn tooting portion of this post. For those who are late to the CNBC party, in the past when I have tooted my own horn here I have used the opportunity to highlight one of my favorite horn players. First up were two jazz trumpeters: Clifford Brown; and Lee Morgan. Today I want to turn my attention to classical music and Dennis Brain, who may be the greatest classically trained horn player of the modern era. If you are not sure whether you are a fan of classical music, you owe it to yourself find a way to introduce your ears to Brain’s 1953 rendition of the Mozart horn concertos. If this turns out to be a transformational experience in your life, don’t say I didn’t warn you.

Wednesday, April 25, 2007

Movin’ On Up

As of last night, I have moved up to #1565 in the CNBC Million Dollar Portfolio Challenge. With 1,273,430 contestants in the running, it appears I will need to pass another 292 to make it in to the top 0.1%. If that happens, I’ll set my sights on the top 1000, then maybe…

My reality check is that tenth place is currently at $2.89 million, safely ahead of my $1.64 million war chest.

As I described yesterday, I rode AKS up after their strong earnings report, but the stock ran out of steam late in the day and finished with a 4.2% gain for the session. Of course I dumped AKS at the end of the day and elected to put my chips on Veeco Instruments (VECO) – a nanotechnology equipment company with a focus on the semiconductor industry. VECO has had a difficult year, lowered guidance for the most recent quarter, and delivered some lackluster numbers last night. Still, strength in their MOCVD business has brightened the outlook somewhat and helped push the stock up 2.5% this morning.

For the record, I recognize that Amazon (AMZN), which is currently trading up 20%, was the obvious earnings play last night, but my thinking is that if you are trying to beat the crowd, you increase your chances dramatically by getting off the beaten path. I can only hope that when it comes to Amazon at least, my competition is thinking along the same lines…

DISCLAIMER: "VIX®" is a trademark of Chicago Board Options Exchange, Incorporated. Chicago Board Options Exchange, Incorporated is not affiliated with this website or this website's owner's or operators. CBOE assumes no responsibility for the accuracy or completeness or any other aspect of any content posted on this website by its operator or any third party. All content on this site is provided for informational and entertainment purposes only and is not intended as advice to buy or sell any securities. Stocks are difficult to trade; options are even harder. When it comes to VIX derivatives, don't fall into the trap of thinking that just because you can ride a horse, you can ride an alligator. Please do your own homework and accept full responsibility for any investment decisions you make. No content on this site can be used for commercial purposes without the prior written permission of the author. Copyright © 2007-2023 Bill Luby. All rights reserved.
 
Web Analytics