Showing posts with label NASDAQ 2315. Show all posts

Friday, April 11, 2008

NASDAQ 2315 Again

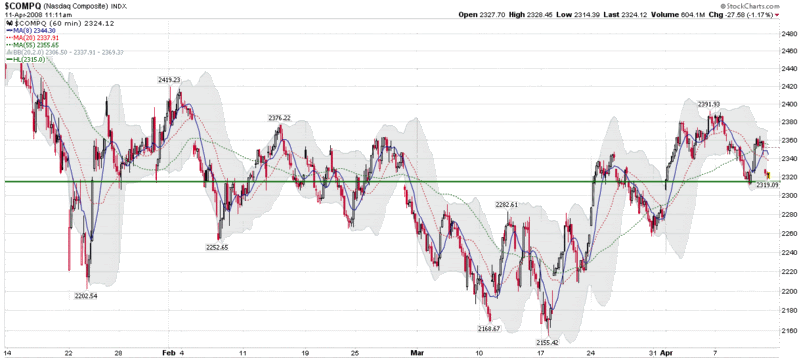
Two months ago I noted that the 2315 level for the NASDAQ Composite Index had figured prominently in several important gaps and served as a critical support and resistance level for the index going back to mid-January.

In range-bound markets – which is what we are in for now until we get a decisive move up or down – these important support and resistance levels end up being revisited on a quite a few occasions and ultimately prove to be an important measuring stick for the strength of subsequent market action.

Looking at the three month chart (with 60 minute bars) below, in the past two months the 2315 level has played an important role in two new gaps, one from the end of February and another at the beginning of April. The end of February gap down served as a ceiling for price action for almost a month, while the April 1st gap up has been the floor for price movements over the course of the past two weeks. Today’s sharp drop tested the gap and the corresponding 2315 level. So far, that test of support has held. As long as 2315 continues to hold, the markets should continue to consolidate and move up from current levels, but should 2315 be breached – and the gap down to 2290 be closed – expect emboldened shorts and panicky longs to put the 2155 low back in to play.
Wednesday, February 13, 2008

NASDAQ 2315-2320

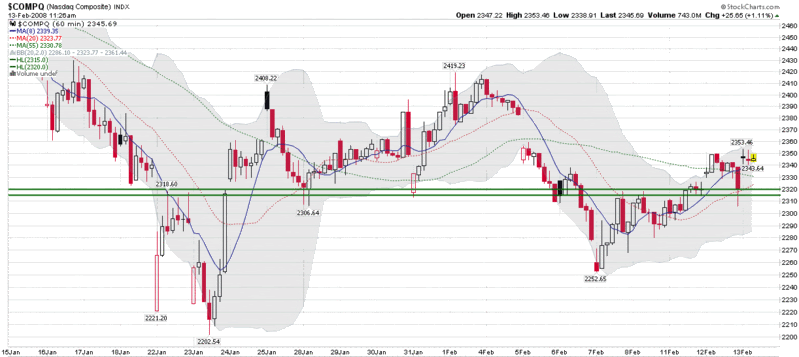
If you have been watching the NASDAQ Composite Index for the last few weeks, it is likely that you have paid close attention the area around 2315-2320.

I usually don’t talk about basic support and resistance levels in the major indices, largely because guys like TraderMike and a host of others cover those bases nicely. Given all the interest associated with whether the market has bottomed or will bottom soon, I chose to focus on 2320 in The Game Is Afoot back on January 25th. With three weeks of hindsight, this has turned out to be an even more critical level than I had expected it would be.

In the chart below, which shows 60 minute bars over the course of the past month, the 2315-2320 area has defined two important gaps and repeated instances of critical support and resistance. If today’s rally continues, it is possible that this level will not be tested going forward; however, if it does get tested again, expect the battle for 2315 to be one of the most important skirmishes that will determine whether the lows of January 22nd and 23rd turn out to be a bottom.

DISCLAIMER: "VIX®" is a trademark of Chicago Board Options Exchange, Incorporated. Chicago Board Options Exchange, Incorporated is not affiliated with this website or this website's owner's or operators. CBOE assumes no responsibility for the accuracy or completeness or any other aspect of any content posted on this website by its operator or any third party. All content on this site is provided for informational and entertainment purposes only and is not intended as advice to buy or sell any securities. Stocks are difficult to trade; options are even harder. When it comes to VIX derivatives, don't fall into the trap of thinking that just because you can ride a horse, you can ride an alligator. Please do your own homework and accept full responsibility for any investment decisions you make. No content on this site can be used for commercial purposes without the prior written permission of the author. Copyright © 2007-2023 Bill Luby. All rights reserved.
 
Web Analytics