VXTYN Measures Volatility in U.S. Treasuries and Potential Spillover Effect
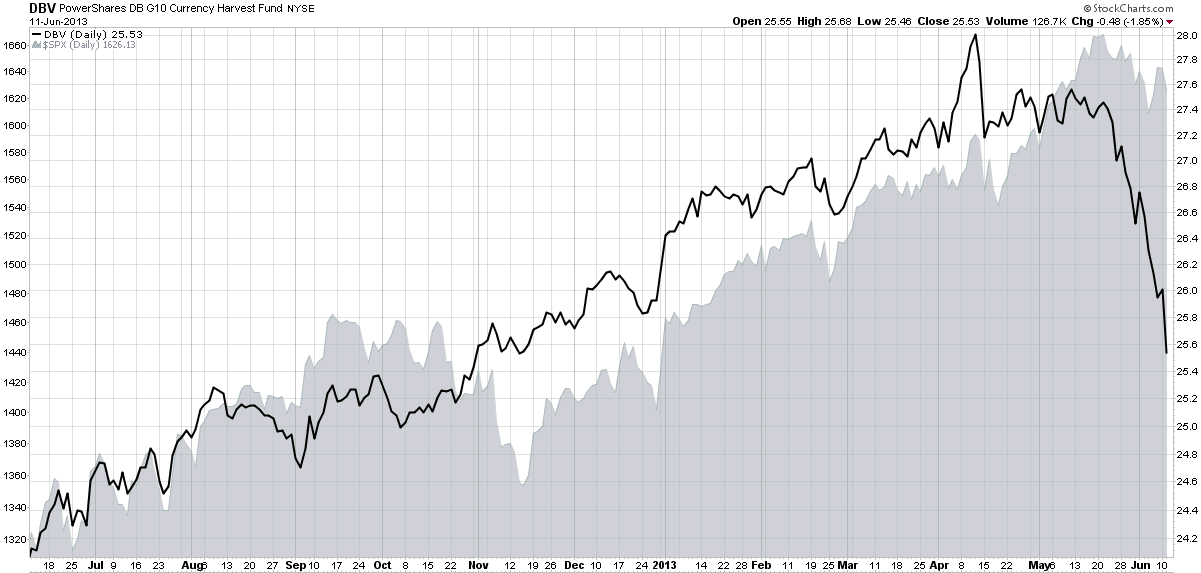
Recently I have been highlighting some non-traditional measures of volatility and risk in the financial markets, including VXEEM (CBOE Emerging Markets ETF Volatility Index); DXJ (WisdomTree Japan Hedged Equity Fund); and DBV (PowerShares DB G10 Currency Harvest Fund). Part of my intent in focusing some attention on these largely under-the-radar indices and ETPs is to get more investors to think about risk more broadly across geographies and asset classes.
One asset class that should absolutely be watched closely by even those stubbornly equity-centric investors (and I know you are out there in larger numbers than you care to admit) is U.S. Treasuries. Of course U.S. Treasuries come in quite a few flavors, but the most important is probably the U.S. 10-Year Treasury Note. In a display of impeccable timing, last month the CBOE and the CFE teamed up to launch a new volatility index based on this security: CBOE/CBOT 10-year U.S. Treasury Note Volatility Index (VXTYN).
In the chart below, I show the path of VXTYN and the SPX going back to January 10, 2013, which is the beginning of the historical data for VXTYN provided by the CBOE. Note that VXTYN only began rising in May and when hit has made a substantial move up, that has preceded a decline in stocks.
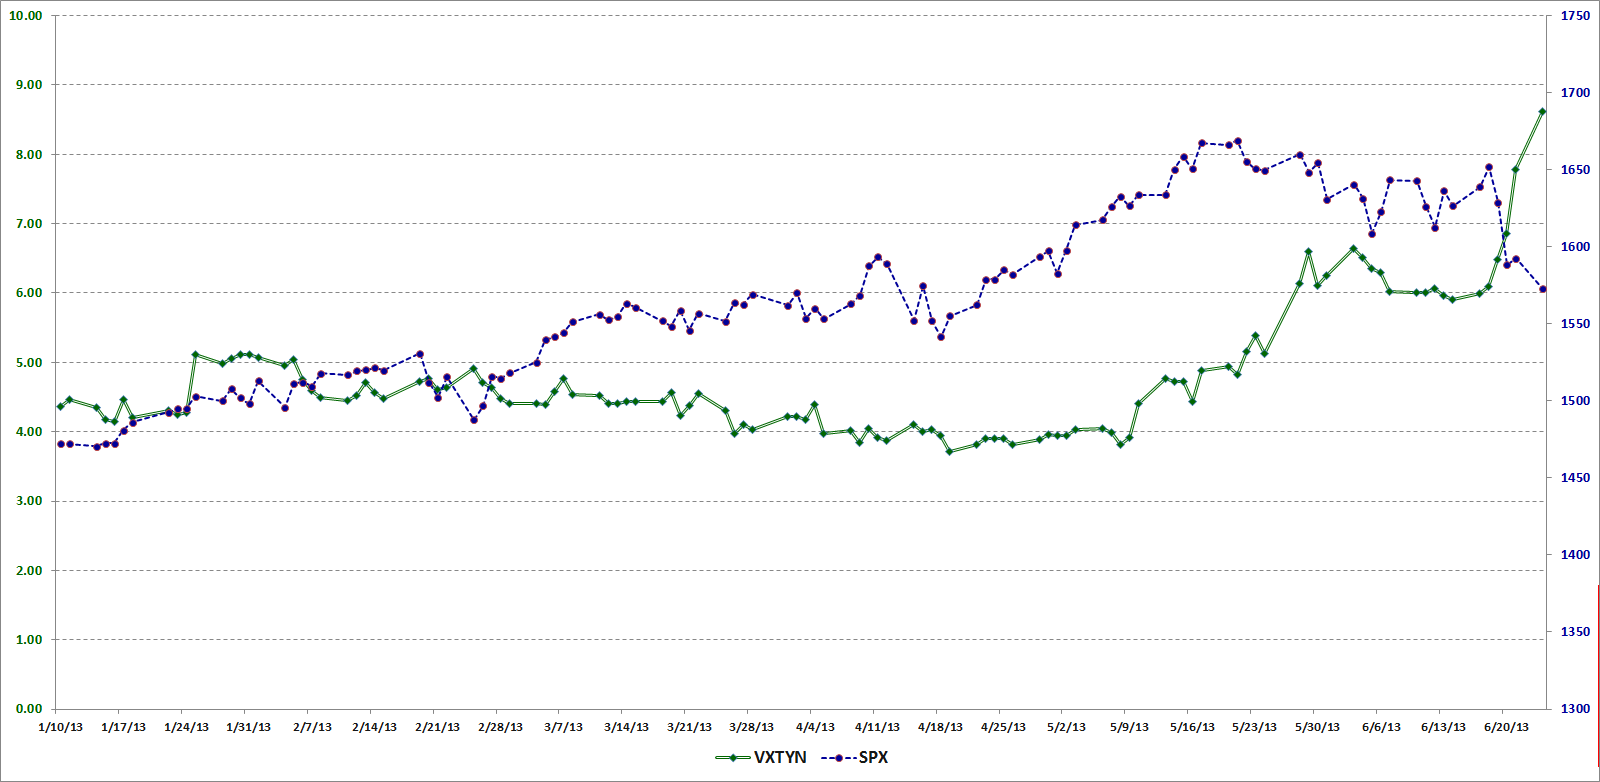
[source(s): CBOE, Yahoo, VIX and More]
Just for fun, I am also including a chart that shows a 21-day rolling average of the correlation between VXTYN and the SPX. Here the relationship between the swings in correlation and subsequent moves in stocks may be easier to visualize. With less than months of historical data to draw on, I would caution against jumping to conclusions regarding correlation and causation, but at the very least I thought this graphic might provide some food for thought.
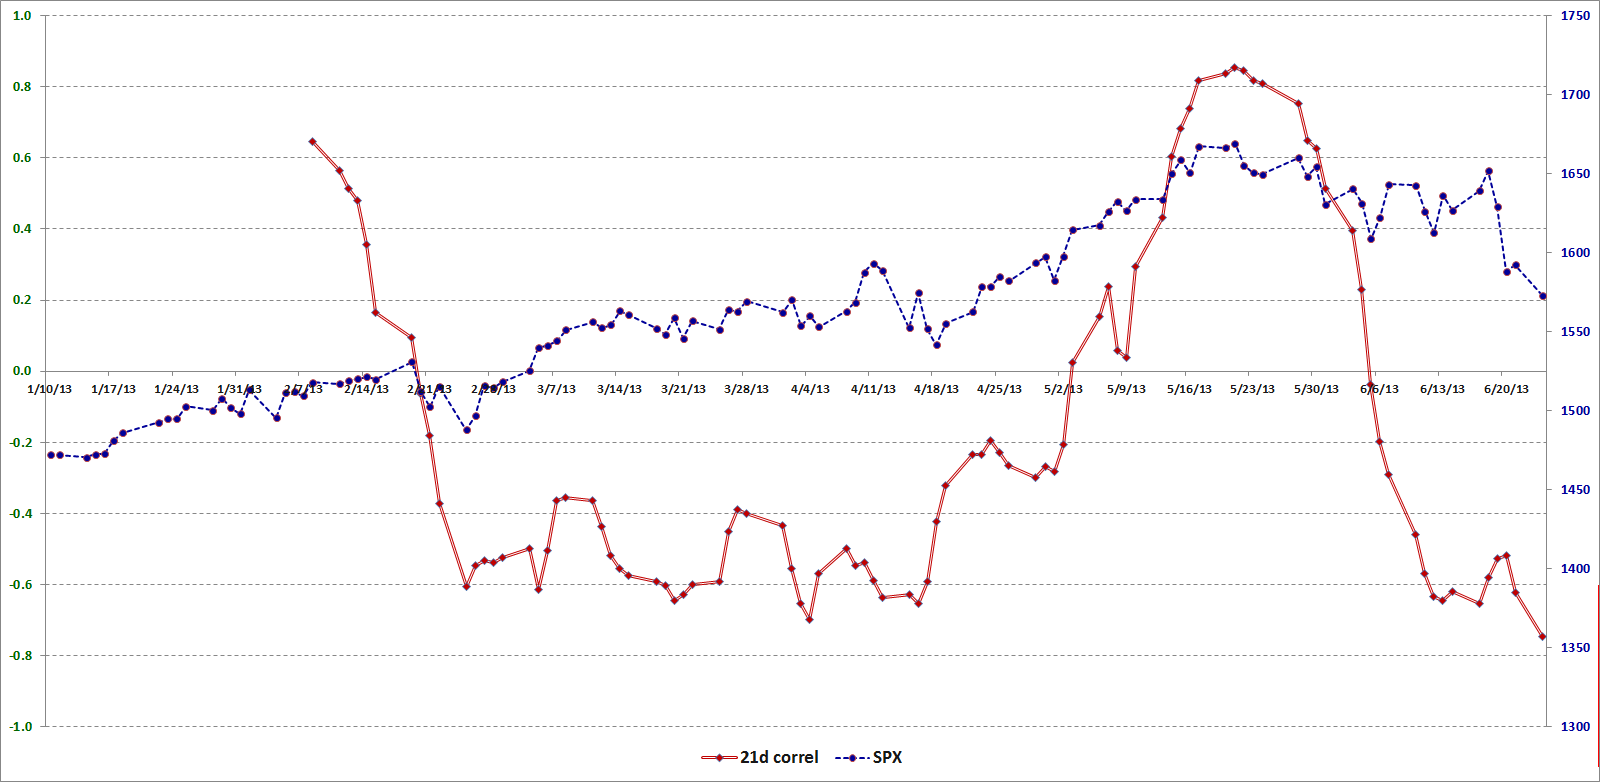
[source(s): CBOE, Yahoo, VIX and More]
Last but not least: did you know there are ETPs for placing bets on whether the Treasury yield curve will get steeper or flatter? I highlighted these products back in 2010 in Treasury Yield Curve ETNs and Volatility; they are known formally as the iPath US Treasury Steepener ETN (STPP) and the iPath US Treasury Flattener ETN (FLAT).
Related posts:
- VXEEM as a Measure of Emerging Markets Volatility and Risk
- Using DXJ to Monitor Development in Japanese Equities, Currency and Risk
- The Currency Carry Trade, DBV and Risk
- Chart of the Week: U.S. 10-Year Treasury Note Yields from 1990
- Treasury Yield Curve ETNs and Volatility
- Chart of the Week: Ratio of VIX to Yield on 3-Month T-Bills
- Recent Developments in Gold and Gold Volatility
- EuroCurrency Volatility Index (EVZ) at Lowest Level Since March 2008, Diverges from VIX
- Chart of the Week: Crude Oil and Volatility
- The Risk Library
- A Conceptual Framework for Volatility Events
- Forces Acting on the VIX
- St. Louis Fed’s Financial Stress Index
Disclosure(s): long DXJ at time of writing; the CBOE is an advertiser on VIX and More