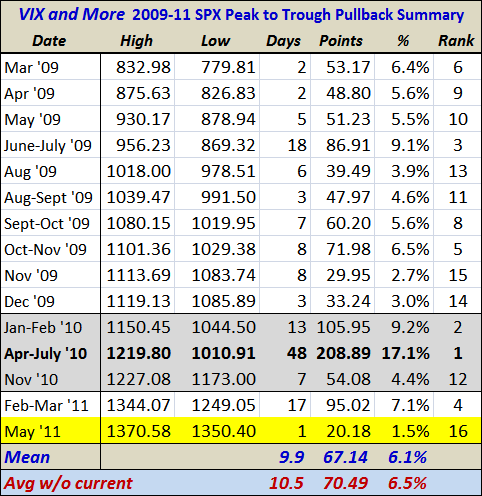
SPX Pullback History, 2009-2011
Since there has been only one significant pullback in stocks so far in 2011, I am taking the mild selling from the last two days as an excuse to update a table of pullbacks that I have been updating periodically since stocks bottomed back in March 2009.
The table captures some of the details of the fifteen significant (in magnitude and/or duration) pullbacks in the SPX during the last 26 months, with the current pullback – so far at only 1.5% from peak to trough – highlighted in yellow.
Not counting the current 1.5% dip, the mean pullback has been 6.5% from the peak, with the median coming in at 5.6%. Using these numbers, a median pullback would take the SPX down to about 1294 and a mean pullback would drop the index down to a little over 1286.
A pullback that matches the 17.1% drop from April to June 2010, which is the largest during this bull market, would drop the SPX back all the way to 1136.
As you think about the current selling and the recent propensity for buy-on-the-dip investors to keep most pullbacks from becoming too severe, this bit of historical benchmarking should be able to serve as a guideline for evaluating how deep and how long the next pullback might extend.

Disclosure(s): none

