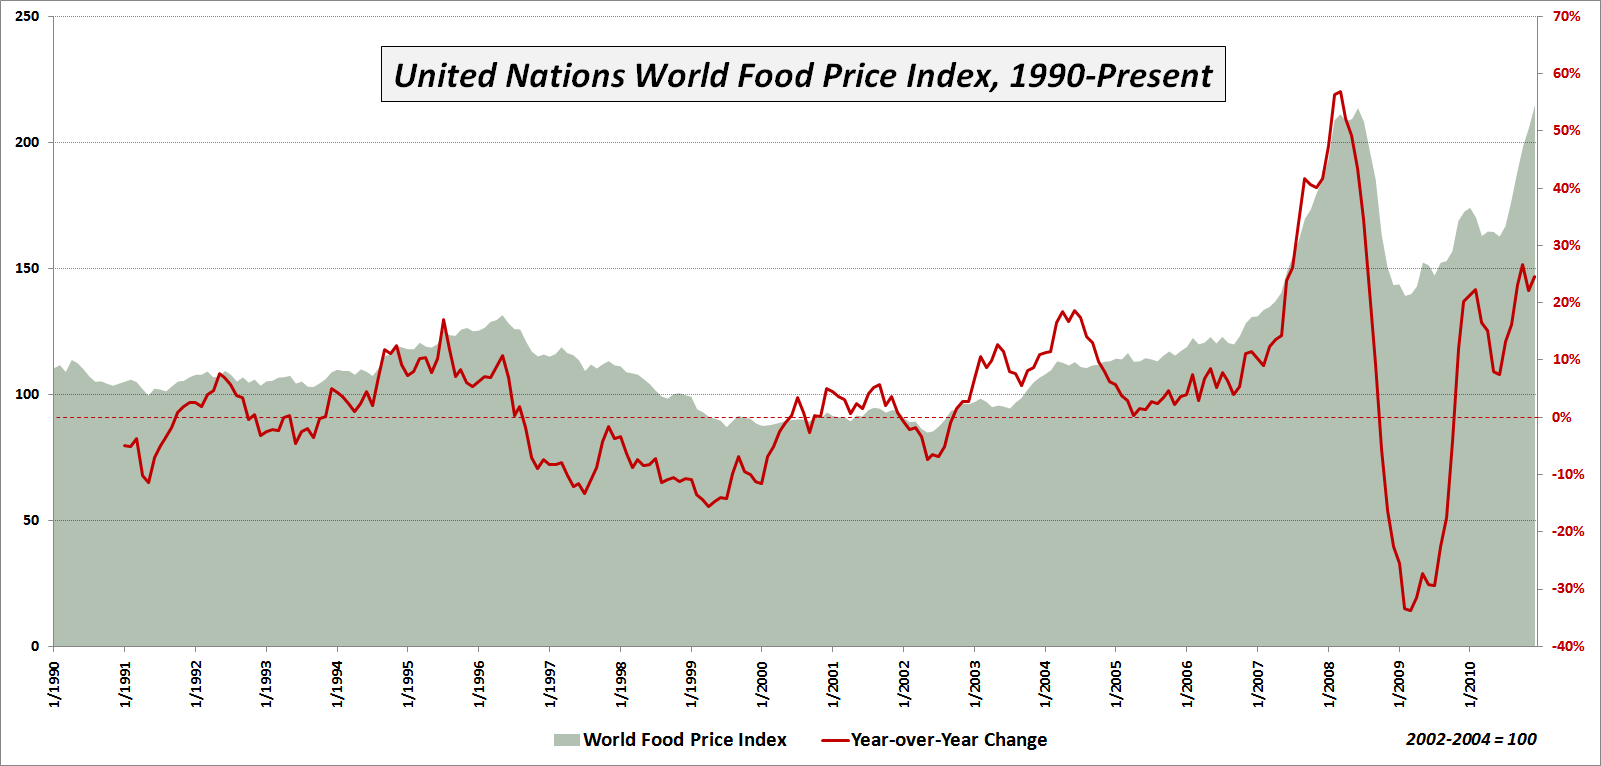
Chart of the Week: World Food Prices
Talk of rising commodities prices seems to focus primarily on energy and metals, with agricultural commodities often overlooked, at least in the United States.
This week’s chart of the week is intended to underscore the inflationary trend in agricultural commodities and ‘softs’ (which generally refer to sugar, coffee and cocoa) as reflected in the United Nations World Food Price Index. As the chart below shows, world food prices hit a new high in December, after jumping more than 54% from a February 2009 low. The new high in the index eclipses the old high from June 2008.
Among the various sub-indices, the most dramatic increase has been seen in sugar, which is up 51% in just four months and is up a staggering 239% over the course of the past two years to a new all-time high. Meat prices are also at new highs, but while the sugar price index currently stands at 398.4, meat has only risen to 142.2. Note that all index values reflect a baseline of 100 that is derived from the 2002-2004 average prices.
Commodities prices have both economic and political implications. The economic implications are particularly severe for emerging markets in which food costs represent a disproportionately high percentage of the typical household budget. Here the incremental increase in food prices can have a disastrous impact on the family cost structure. There are also some countries where the possibility of food riots and related civil unrest has the potential to destabilize those who are in power and in some cases perhaps even thrust the political system into chaos.
So far rising food prices have triggered only a mild backlash here and there, but should prices continue to rise at the current rate of more than 20% per year, it is not possible to rule out catastrophic consequences across the globe.
Related posts:
- Wheat and the Commodity ETF Space
- LSC Long-Short Commodities ETF Struggling Mightily
- Chart of the Week: Impact of Falling Euro on Stocks and Commodities
- Chart of the Week: Commodities and the Dollar
- Chart of the Week: Breaking Out Recent Commodities Moves
- CME to Use VIX Methodology for New Crude Oil, Corn, Soybean and Gold Volatility Indices
- Agricultural Commodities vs. Base Metals

[source: United Nations]
Disclosure(s): none

