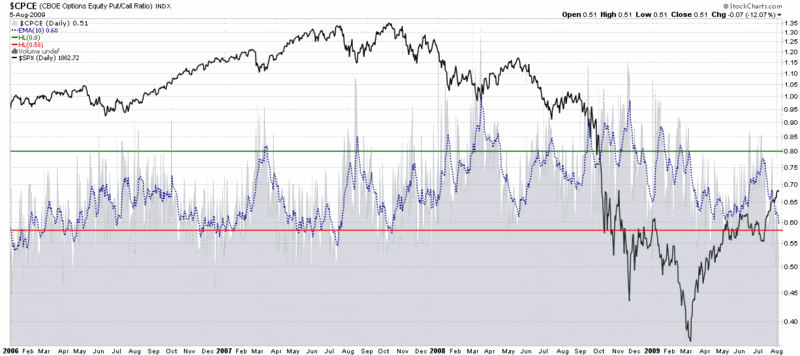
CBOE Equity Put to Call Ratio in Bear Territory
Lately I have been dipping my toe in the water on the short side – only to discover that something resembling an alligator seems intent on severing my leg at the ankle. Fortunately, I have managed to keep the stakes low to this point, but during today’s session I took a much more aggressive stance and bought a large quantity of puts.
In the process of reshaping my thinking, I found two indicators in particular to be persuasive. The first is the TRIN, where I am partial to using a 10 day EMA to smooth the data. Today it closed at a level seen only once since the beginning of 2006, just as the market put in a short-term top after a week and a half of bouncing off of the March lows.
Even more persuasive is the CBOE equity put to call ratio (CPCE), where the 10 day EMA hit a low of 0.51 – a level which has not been seen since the October 2007 top. The chart below shows that a low CPCE warned of excessive optimism and the possibility of a top first in July 2007, when the SPX began to form the first half of a double top and again in October 2007, just as the market was topping for the second and final time.
For a different take on today’s CBOE equity put to call ratio, I can highly recommend 08/05/09 Market Recap: CPCE a little too low again, from Cobra’s Market View.
For some related VIX and More posts on the CPCE, try:


14 comments:
Cobra has been Bearish since March. Not that the study isn't interesting.
I'm buying it. Take a look at the NYSE declining volumes ($NYDNV). We're taking a nose dive !
Pierre
monthly chart of $SPX. 200MA is 1016. if spx fails to break out the level and plunges again, the 200MA line would point downward...
1016? 1021? who knows. i guess there will be more obvious sign around this month's OE date.
It's hard to see the current market momentum abating anytime before S&P hits 1050. Instead of buying index puts, it may be wise to sell individual stock puts. Stock picking and selling its puts may be a better game going forward.
Well...today's non-farm payrolls destroys (or at least significantly degrades) about 90% of the arguments that the bears have been making of late.
One by one, the panic selling scenarios are coming off the table.
Looks like the call buyers will be nicely rewarded this time around. Put to call ratios were not an effective contrarian sentiment indicator for the current market environment.
Cheers,
-Bill
vix:vxv is steadily going up since vix has been steady lately. dollar had some bounce but still not strong enough. cash for clunker program is gonna prop up the gdp artificially. i guess the market has more room to go up... and it will be very difficult to spot the top. the late waders will start jumping in.
yeap, like last September/October when majority of indicators were broken as buy signals failed, now it looks like plenty of sell signals from these same indicators are laid to waste too.
have been running a few studies on the low reading, including the fact that the 10MA has approached 0.61 recently. When you look at this on a chart (overlay a 10ma of the $ECPC), it seems to indicate that this is bearish. However when you run studies to guage performance, the results are mixed it seems. Infact, for the very short term, the results actually seem to be POSITIVE! I'll probably post the results later.
Very interesting, Small Fish. Feel free to link to your post here when it is up.
Cheers,
-Bill
yeah the signals r all mixed. but dollar could be making a significant turning point now as more bearish bets r piling on energy sector. i was surprised to see the strong dollar bullishness and energy bearishness today. the gold didn't break out the resistance. baltic index is down a lot this week.
commodity correction is coming soon.
Hi Bill,
here is a link showing a study of the 21 day MA of the equity P/C and it's short and long term implications. Please double check for accuracy or perhaps bad interpretation of data.
http://smallfishbigodds.blogspot.com/2009/08/equity-putcall-everyone-winner.html
After the October 1929 crash, Wall Street staged a 50% rally, just like the rally we had from March to now. Also the 1929 rally occurred during a five-month period from November 1929 to April 1930, just like our current rally has spanned from the beginning of March to the beginning of August.
What does this tell us?
This market is playing out exactly like the post-1929 crash period, and they made the SPX bottom at 666 with the intent to take it to 1000 -- a big nice round number -- after a 50% rally.
Come on: this market is all "pre-programmed" and they had written its script a long time ago.
As a "carbon copy" of the 1929 crash.
Post a Comment