Chart of the Week: Putting Nonfarm Payrolls in Context
For the sake of the economy and the national psyche, I was just as happy as the next person to hear that Friday’s nonfarm payrolls were better not as bad as had been expected.
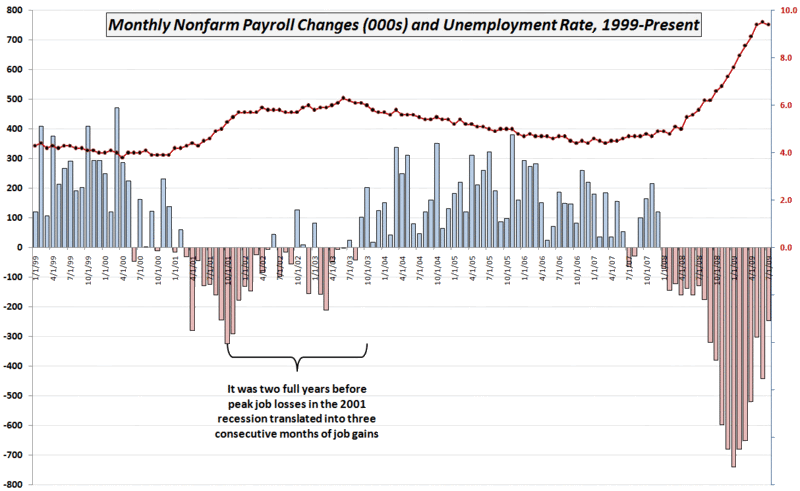
The 247,000 jobs lost in July were the lowest since August 2008 and less than half of the job losses suffered in each month from November through April.
I last highlighted nonfarm payrolls in a chart of the week just over two months ago: Chart of the Week: Nonfarm Payrolls, Unemployment Rates and Time. In that post and accompanying chart, I stressed that following the peak job losses of 325,000 in October 2001, it was 19 months before there was a sustained improvement in the unemployment rate and a full 3 ½ years before the unemployment rate was below the October 2001 rate on a sustained basis.
This week’s chart of the week adds two more months of data to the previous chart and highlights another important point about the monthly job report. In the last recession, it was two full years from peak job losses to three months of consecutive net job gains. Further, while the 247,000 job losses sounds like considerable progress in the context of the recent job situation, July would have been the third worst month for job losses during the 2000-2003 bear market.
So while the July employment numbers are undoubtedly a step in the right direction, we are a long way from the type of data that should be a cause for celebration.

[source: Bureau of Labor Statistics]


1 comments:
Why is the number of people who quit searching for work not an alarming issue here? Seems like everyone knows this stat, yet ignores it. I think the number was 400k+. I find no solace in the new unemployment rate number. Ultimately we track unemployment to understand the fiscal health of the average American and his/her ability to consume, save, invest, and pay down debt. Those jobless and uncounted people are not spending, not investing, not paying debt. That's bad right? Did they count this way during the depression when they had 25% unemployment? Somehow I doubt it.
Post a Comment