Introducing the Parabolic Stop and Reverse (SAR)
Yesterday, a reader asked about the usefulness of the parabolic stop and reverse indicator, sometimes called the PSAR or SAR. Since this is one of my favorite not-quite-mainstream indicators, I thought I would take a moment and mention some of the reasons why I am a fan of the SAR. One thing led to another and before I knew it, my simple response had grown to Tolstoyan proportions. For that reason, I am going to address the SAR over the course of several posts.
The SAR was unveiled by Welles Wilder as part of the groundbreaking 1978 classic, New Concepts in Technical Trading Systems. Even after more than three decades, the achievements in this book still boggle the mind. In one fell swoop, Wilder launched the RSI (relative strength index), ATR (average true range), ADX (average directional indicator) and SAR, along with several lesser known indicators (e.g., commodity selection index, swing index, etc.) that probably deserve much more attention.
When it comes to adding more indicators to one’s TA toolbox, I am always a little hesitant to do so, as I prefer to keep things simple rather than make them too complex. This bias for “less is more” when it comes to indicators is partly due to the fact that so many of the indicators share some computational ancestry that the value added is often a lot less than meets the eye.
With those caveats in mind, I consider the SAR to be an exception. Specifically, the SAR is a unique combination of price and time. It works particularly well in trending markets and perhaps best suited to being implemented as a trailing stop mechanism.
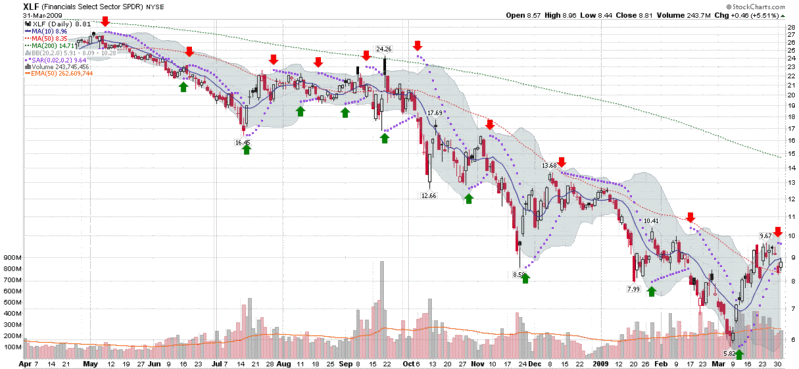
This time around, I will not delve into the details of the calculations of the SAR; instead, I will provide a quick overview of how the SAR works. In the chart below, I have captured data in XLF, the financial ETF, going back one year. The SAR values are represented by the purple dots that are overlays on the price chart. When the purple dots are below the candlesticks, this indicates rising prices; when the purple dots are above the candlesticks, this indicates falling prices. Each time a change in trend is signaled, the purple dots flip from the bottom to the top or the top to the bottom. To make these reversal signals easier to identify, I have added green and red arrows to indicate trend reversals.
The SAR assumes traders are always in the market. Very simply, when the trend reverses, the SAR signals a new position should be initiated. To get a sense of how the SAR values move, review the new short signal from the second week in December. Note that the SAR is a good distance above the initial short entry signal, but as time passes, the SAR continues in the direction of the original signal, regardless of whether the market follows the trend or not. This brings the SAR close to the price at the beginning of the year. Take note also that as XLF begins to move sharply down in the beginning of January, the SAR accelerates down with it and stays close to the price action. When XLF finally reverses in the last week in January, the trailing stop is so tight that one bullish gap up day triggers an exit. This is the essence of the SAR: it gives gradual trends some time to gather momentum, hugs sharp trends closely, and acts as a tight stop should the trend begin to change direction.
Now study the balance of the chart. Notice that when XLF was in a persistent trend (May, June, October, etc.), the SAR performed quite well. When XLF traded sideways, however, as it did in August, the SAR was responsible for quite a few whipsaws.
In the next article in this series, I will delve deeper into the calculations behind the SAR and discuss some of the preferred approaches for applying this indicator.
[source: StockCharts]




