Showing posts with label TSL. Show all posts

Friday, April 4, 2008

Chinese Solar Stocks on the Rise

Two areas that have been rife with speculative frenzy – both bullish and bearish – over the past year or so have been China and solar stocks. Not surprisingly, the space where the two intersect, Chinese solar stocks, has been one of the most volatile segments of the market.

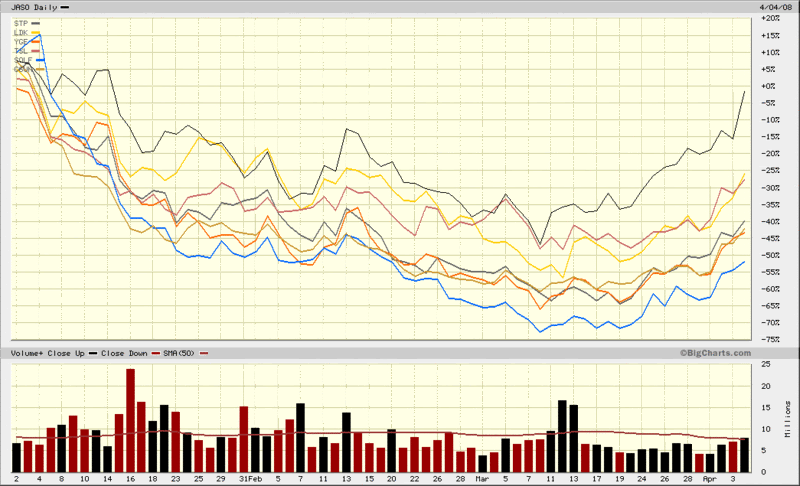
I have elected not to show the long-term chart of these stocks, which looks a lot like a higher beta version of the chart of the FXI. Instead, the chart below compares the year-to-date performance of the most significant players in the Chinese solar space that are traded on US exchanges: JASO; STP; LDK; YGE; TSL; SOLF; and CSUN. I left JASO as the anchor and show the volume in this stock at the bottom of the chart because JASO is the biggest gainer of the year so far and the chart shows that after the March 10th bottom, strong volume flowed into the stock over the next three days, marking the beginning of the current leg up.

Given their high profile and speculative history, Chinese solar stocks can be an excellent speculative barometer, not only for China and the solar sector, but for the markets as a whole. More importantly, where there is strong speculative activity, particularly coming off of a sharp bear move, there is increased confidence in the markets and a high degree of perceived opportunity.

Thursday, November 1, 2007

What’s in the FXI?

Now that the iShares FTSE/Xinhua China 25 Index (ticker FXI) is regularly trading 5 million or so shares per day, it would be fairly easy for a trader to make a living trading just this one basket of China stocks. It has volatility, it has options (check out the new Morningstar options data if you haven’t already), and it will soon have a 2x inverse ETF (ticker FXP) if you want to play the other side at twice the speed.

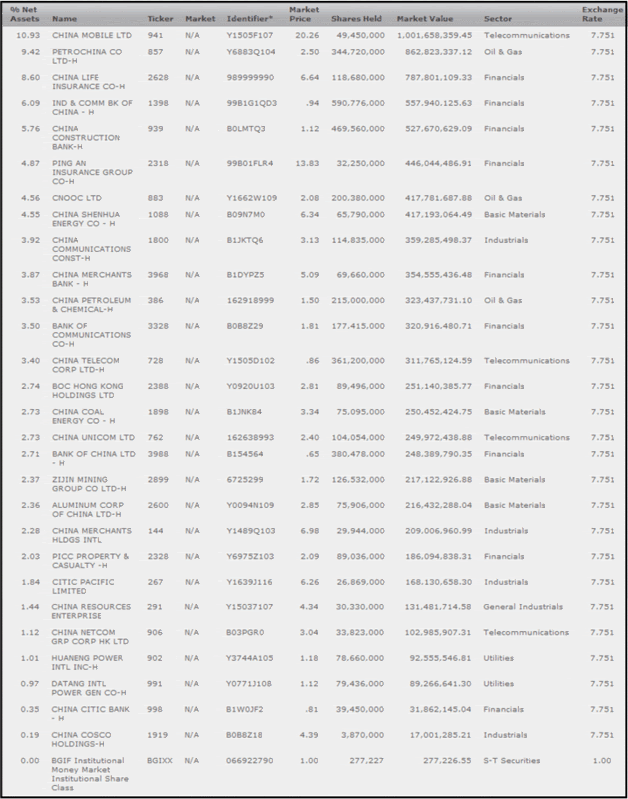
But what is in this index? Note that the China internet stocks (BIDU, FMCN, SOHU, SINA, etc.) and the China solar stocks (LDK, JASO, TSL, YGE, etc.), both recent market darlings, are conspicuously absent from the list. I have included an October 31, 2007 snapshot of the components of the FXI, with all quotes from the Hong Kong Stock Exchange:


Ten companies included in the FXI are also traded on the NYSE with ADRs. For easy reference I offer links to a Yahoo Finance version of that list in an intra-day format and also in the more detailed summary format. At the moment, all ten companies on this list are trading down 2-6% for the day, while the FXI is down 3.4% after hitting a new high of 219.56 during yesterday’s trading session.

When the FXP arrives, I will probably give it a test drive, but not until there is more convincing evidence that the FXI has put in at least a short-term top. At that point, the volume in the FXP may also provide some interesting clues about investor sentiment, specifically the breadth and depth of concern about a bubble in the Chinese stock market. For now at least, there is no reason to believe that the China trend is going to end soon and the best place continues to be on the long side.

Wednesday, May 23, 2007

CNBC Loser’s Bracket:: #1056 (Top 1%)

For those who may be interested, the CNBC Million Dollar Portfolio Challenge is winding down this week, with 20 top performers duking it out for $1 million paid out over many years through an IV drip, while the Second Chance Showdown contestants get another shot at glory in the loser’s bracket – with a Sony home entertainment system as a consolation prize to the winner.

I never had a chance to properly chronicle the true extent of my rise and fall in the first round of this contest, as CNBC wiped away the details before I do a proper post-mortem. All I know is that after peaking at the top 0.08%, I fell down to about the top 11%, finally finishing something like 200,000th, perhaps even lower.

The good news is that the contest gave me an opportunity to test some ideas about how to find stock that were about to make a significant move. Since the end of the contest fell in the middle of earnings season, I focused on companies that were due to report in the next 24 hours and published the details of my formula and some associated free public information sources in “How to Find the Spiker Before the Earnings Announcement” on May 9th. Recently, I went back and evaluated the 16 companies that I invested in as a result of that earnings spiker formula and discovered that the minimum next day move for those companies was 1.5%, while the maximum move was 30.2% (down in this case), with a mean move of 5.6% and a median move of 3.7% – all of which is based on a one day holding period.

Armed with this information, I thought I should put the same formula to work again in the loser’s bracket. Once again it has been successful, with my last four picks being a 3.0% gain in PETM, a 7.7% gain in FMCN, a 5.3% gain in TSL, and a 3.0% gain in SNDA. The bottom line is that this performance has put me in the top 1% of the current contest at #1056.

Before I start patting myself on the back, however, it looks like I may have shot myself in the foot. Shanghai-based Shanda Entertainment was a solid earnings pick and turned in a very strong quarter, but it appears I was foiled by my own Lost in Translation moment and accidentally sold prior to earnings. To make matters worse, I jumped from the Shanda rocked onto GameStop (GME), whose doubling of revenues was offset by lukewarm guidance. I got my volatility again, but GME is currently trading down 3.6% on the day.
DISCLAIMER: "VIX®" is a trademark of Chicago Board Options Exchange, Incorporated. Chicago Board Options Exchange, Incorporated is not affiliated with this website or this website's owner's or operators. CBOE assumes no responsibility for the accuracy or completeness or any other aspect of any content posted on this website by its operator or any third party. All content on this site is provided for informational and entertainment purposes only and is not intended as advice to buy or sell any securities. Stocks are difficult to trade; options are even harder. When it comes to VIX derivatives, don't fall into the trap of thinking that just because you can ride a horse, you can ride an alligator. Please do your own homework and accept full responsibility for any investment decisions you make. No content on this site can be used for commercial purposes without the prior written permission of the author. Copyright © 2007-2023 Bill Luby. All rights reserved.
 
Web Analytics