Showing posts with label skew. Show all posts

Friday, June 8, 2012

A Favorite Trade: VXX Weeklys

I might as well admit this up front: weekly options are one of my favorite innovations in many years and VXX weeklys have become one of my preferred trades during the past few months.

Why? Several factors are at play. Huge implied volatility is a plus, as is growing liquidity, the ability to employ VXX for speculative and/or hedging purposes, and the applicability of VIX-based ETPs as trading vehicles for the news cycle.

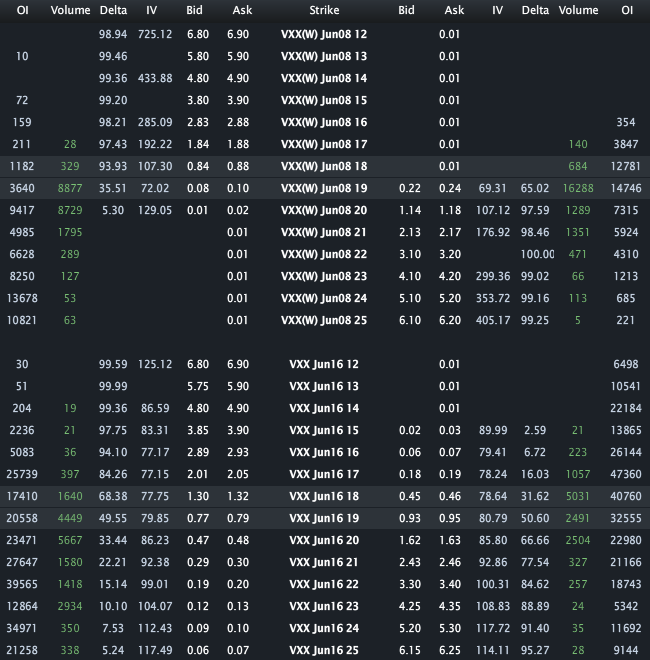
The chart below shows the VXX weekly options that expire today and compares them to options on the standard monthly options expiration cycle, which still have one week left until expiration. Note that with three hours left in today’s trading session, the implied volatility (and skew) of the VXX options is distorted as we approach expiration. Whereas the options that expire next week have an implied volatility reading in the 77 – 125 range, today’s weekly options prices have IVs of over 700 on the call side and over 400 on the put side. While this may seem outrageous, given the fact that the VIX can spike without warning and the VIX futures and VXX will move sharply in conjunction with the cash/spot VIX, options prices (and thus IV) have to account for the possibility of a spike – particularly in light of the recent news cycle.

If you think VXX IV and options prices are crazy, then perhaps it’s time you considered trading the VXX weeklys.

To reiterate what I hope is obvious to everyone who follows the VIX and the options market, VXX options are extremely aggressive trades and are probably best traded as spreads or in other defined risk positions rather than those which expose the trader to unlimited risk.

More on this (these) subject(s) in the coming weeks.

Related posts:

[source(s): LivevolPro.com]

Disclosure(s): Livevol is an advertiser on VIX and More

Sunday, October 17, 2010

Chart of the Week: The Google Volatility Story

If there is one widely accepted tenet of volatility that my wife refuses to give in to, it is that when a stock falls sharply its implied volatility almost automatically increases, yet when that same stock jumps sharply, its implied volatility almost automatically decreases. Volatility should be directionally agnostic, she insists, whether it is implied volatility or historical volatility.

In the case of stocks, a balanced bi-directional view of volatility rarely prevails. The main reasons for asymmetric volatility expectations have to do with the beliefs that are associated with extreme price movements. The old aphorism, “Stocks take the stairs up, but the elevator down” has some statistical support and for most traders, considerable confirmation in terms of personal experience. Said another way, when something positive happens to a company, it rarely creates a virtuous cycle that lifts its stock price skyward. On the other hand, when things go bad, the dominoes have a habit of lining up in such a way as to create a vicious cycle of bad news, which some investors have dubbed the “cockroach theory” due to the fact that there never seems to be just one cockroach.

Partly as a result of elevators, cockroaches and personal experience, most equity options demonstrate a negative volatility skew (also known as a reverse skew or “volatility smirk”) in which out of the money puts have substantially higher implied volatility than out of the money calls.

This week’s chart of the week shows the curious phenomenon that my wife takes issue with. Specifically, Google’s (GOOG) stock price jumped 11% on Friday following a very strong earnings report. As the chart below shows, historical or realized volatility jumped dramatically (20-day historical volatility almost doubled from 21 to 41,) while implied volatility fell sharply (30-day implied volatility dropped from 30.24 to 25.35.)

With Google’s earnings out of the way, clearly some event volatility was removed from the stock’s immediate outlook, but did Friday’s 60 point jump in the stock prices really make it less susceptible to future volatility. That is what the data would have us believe…

Related posts:


[source: Livevol Pro]

Disclosure(s): Livevol is an advertiser on VIX and More

Friday, March 26, 2010

Volatility Skew Charts from Livevol

Yesterday’s post on ETFreplay.com triggered so many favorable comments about this site and their graphics that it occurred to me I had neglected to mention that Livevol has added some new volatility skew graphics to Livevol Pro.

In the chart below, I have captured a snapshot of the implied volatility skew in USO, the crude oil ETF. With USO at just under 39 as I type this, the Livevol graphic captures the IV skew in the April (red line), May (yellow line), July (green line) and October (blue line) options. The April front month options have a steep smile, while the July options reflect the more classic flatter smile. Note that the May options look more like a smirk. I have not discussed volatility skew much to date, but I think it is time the blog dove into the Greeks, volatility skew and some more advanced options analytics, so this is definitely on my list of things to do going forward.

If anyone wishes to learn more about these skew graphics and get a better sense of how to interpret them, a good place to start is at the Livevol blog.

Finally, I can’t help but wonder whether I am the only one who thinks about the Aurora Borealis while looking at these skew charts…

For more on related subjects, readers are encouraged to check out:


[source: Livevol Pro]

Disclosure(s): Livevol is an advertiser on VIX and More

DISCLAIMER: "VIX®" is a trademark of Chicago Board Options Exchange, Incorporated. Chicago Board Options Exchange, Incorporated is not affiliated with this website or this website's owner's or operators. CBOE assumes no responsibility for the accuracy or completeness or any other aspect of any content posted on this website by its operator or any third party. All content on this site is provided for informational and entertainment purposes only and is not intended as advice to buy or sell any securities. Stocks are difficult to trade; options are even harder. When it comes to VIX derivatives, don't fall into the trap of thinking that just because you can ride a horse, you can ride an alligator. Please do your own homework and accept full responsibility for any investment decisions you make. No content on this site can be used for commercial purposes without the prior written permission of the author. Copyright © 2007-2023 Bill Luby. All rights reserved.
 
Web Analytics