Showing posts with label after hours. Show all posts

Friday, May 29, 2009

Late Day Rallies, the SPX and the VIX

Today was an interesting trading day, particularly during the last hour of equity trading.

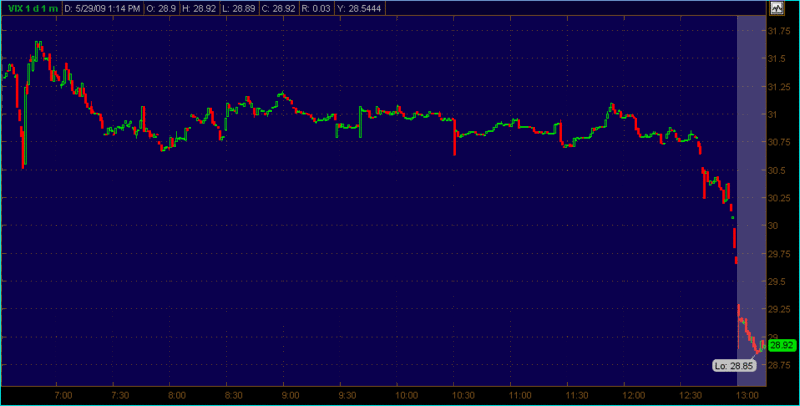
The graphic at the bottom records (in Pacific Time) the intraday movements in the VIX, which was essentially flat for all but the first hour and the last 22 minutes of trading. At 3:00 p.m. ET, the VIX stood at 30.97, down 0.70 (-2.21%) from yesterday’s close. At that same moment, the SPX was at 906.67, down 0.16 (-0.02%) for the day.

The SPX began a slow and steady rise at the beginning of the last hour of trading, with the VIX gradually pulling back. The table below captures the changes in the VIX and SPX during that last hour. Note that the VIX, whose values are updated every 15 seconds, begins to move sharply at 3:38, then creates the first of several gaps at 3:41. By 3:59, one minute before NYSE trading closes, the VIX has moved about 4.5x of the percentage change in the SPX, in the opposite direction. At 4:00 the stocks that comprise the SPX stop trading. The daily high of 920.02 for the SPX was recorded in the minute that followed, as some trade data trickled in after the bell. During the two minutes after the close, the SPX was revised down in small increments several times, before being finalized at 4:11.
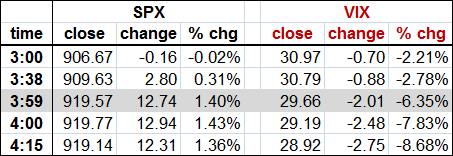

While the individual components of the SPX stop trading at 4:00, SPX index options trade for an additional 15 minutes in what I like to refer as the twilight zone trading period. This can lead to some interesting VIX prints, particularly if there is a strong move in the SPX toward the end of the regular trading session or if important news breaks during the 15 minute twilight zone. What apparently happened today is that the supply of SPX options overwhelmed demand in the last few minutes of the regular trading session and carried over into the 15 minutes of index options trading. By the time the VIX was finalized, at 4:15 p.m. ET, it had fallen all the way to 28.92, a move that was 6.4x the percentage change of the SPX, in the opposite direction.
Normally, when one sees a dramatic change in the ratio of the VIX to SPX percentage moves, this is indicative of a substantial imbalance in the supply and demand equation for SPX options.

As a side note, those who are analyzing historical VIX and SPX data should be aware that the different cutoff times can occasionally lead to some unusual data anomalies.

For additional information, check out a related post on this subject from January: VIX (and VXN) After Hours.


[source: thinkorswim]

Thursday, January 22, 2009

VIX (and VXN) After Hours

I recently received a question about large movements in the VIX at the end of the day.

Before I answer this question, it is important to recall that trading hours for index options are 9:30 a.m. – 4:15 p.m. ET.

As I see it, this question about late day movements in the VIX spans two very different time frames:

  • the last 15 minutes or so of the regular equities trading day (3:45 – 4:00 p.m. ET)
  • the 15 minutes following the close of trading of equities, during which stock index products are still traded (4:00 – 4:15 p.m. ET)

Looking at the earlier period first, during the last 15 minutes of regular trading on the NYSE and NASDAQ, high volume program trading often kicks in and includes or sometimes triggers a large volume of SPX options trades. These situations are relatively easy for retail trader to spot on the tape and are generally consistent with sharp moves in the SPX.

The fifteen minutes of index trading following the close of the equities market are more often associated with unusual large moves in the VIX. Part of the reason for this is the large volume of news that is announced just after the market close. Included in these announcements, of course, are earnings reports, such as today’s eagerly anticipated report from Google (GOOG).

In an announcement that crossed the wires at 4:01 p.m. ET, Google beat analyst estimates for both revenues and earnings, sending the stock up over 2% in the 15 minute twilight zone while index trading was still open.

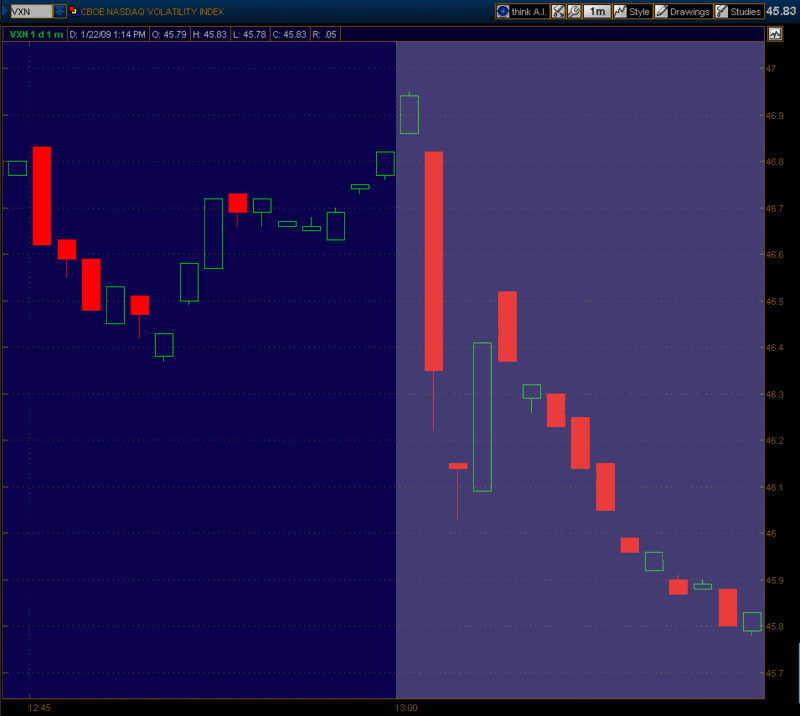
Google is the second largest component of the NDX (NASDAQ-100), so the obvious place to see Google’s impact on the volatility indices is the VXN. The chart below, courtesy of thinkorswim, shows the VXN during the last 16 minutes of today’s regular equities trading session (using my local PT time stamp), as well as during the 4:00 – 4:15 end of the index trading session. The chart shows the positive surprise in Google helped to push VXN down 0.99 (2.1%) in the 15 minutes after the close of trading in the NYSE and NASDAQ regular session. Had Google beaten analyst expectations by a larger amount – or had a significant miss – I would not have been surprised to see the VXN move 5-10% during the twilight zone.

[source: thinkorswim]

DISCLAIMER: "VIX®" is a trademark of Chicago Board Options Exchange, Incorporated. Chicago Board Options Exchange, Incorporated is not affiliated with this website or this website's owner's or operators. CBOE assumes no responsibility for the accuracy or completeness or any other aspect of any content posted on this website by its operator or any third party. All content on this site is provided for informational and entertainment purposes only and is not intended as advice to buy or sell any securities. Stocks are difficult to trade; options are even harder. When it comes to VIX derivatives, don't fall into the trap of thinking that just because you can ride a horse, you can ride an alligator. Please do your own homework and accept full responsibility for any investment decisions you make. No content on this site can be used for commercial purposes without the prior written permission of the author. Copyright © 2007-2023 Bill Luby. All rights reserved.
 
Web Analytics