Showing posts with label DB. Show all posts

Tuesday, February 21, 2012

Credit Suisse Suspends Creation Units in TVIX: What It Means

After today’s regular trading session, Credit Suisse (CS) announced in a brief press release that it has “temporarily suspended further issuances of the VelocityShares Daily 2x VIX Short-Term ETNs (TVIX) due to internal limits on the size of the ETNs.” The company added that “[t]his suspension does not affect the Early Redemption rights of noteholders as described in the pricing supplement.  Other ETNs issued by Credit Suisse are not affected by this suspension.”

The announcement by Credit Suisse raises a lot of questions and I will see what I can do to answer some of the more pressing ones this evening.

While this is all speculation, based on the “internal limits on the size of the ETNs,” it sounds as if the recent exponential growth in TVIX has violated a position size risk control rule relative to the VIX futures products that comprise the S&P 500 VIX Short-Term Futures Index ER [excess return] on which TVIX is based. Of course we do not know how much the volatility of those VIX futures products is factored into the position size issue, but given the overhang of events in Europe, China and Iran, I can certainly make the case for a very conservative approach to risk control for any VIX futures exposure at the moment.

The suspension of creation units means that the 40,725,000 shares outstanding represents the upper limit for Credit Suisse. While Credit Suisse describes the action as temporary, there is no particular reason to believe the suspension will be a matter of days. It could possibly be weeks or longer before Credit Suisse agrees to issue new TVIX creation units. Back in 2009, for instance, the United States Natural Gas Fund (UNG) experienced regulatory approval issues for creation units and suspended new creation units for seven weeks. At one point in time, UNG traded as high as 16% over net asset value, but that premium turned out to be a temporary spike. Suspension of creation units, while unusual, does happen on occasion. Less than two weeks ago, to pick a recent example, Deutsche Bank (DB) halted creation units on seven of its commodity ETNs.

The big question for investors is whether the suspension of creation units will mean that TVIX trades at a premium or discount to its net asset value. Given that supply is constrained and demand is not, the most likely scenario is that TVIX will trade at least as high as net asset value or possibly at a premium. Valuation will be highly dependent upon arbitrage opportunities and there are quite a few arbitrage opportunities should TVIX begin to separate from its NAV. VIX futures provide an attractive source of arbitrage firepower, as does the very similar 2x VIX futures ETF, UVXY, formally known as the ProShares Ultra VIX Short-Term Futures ETF. Arbitrage opportunities are also available via VXX, VIX options as well as options on SPX/SPY, etc.

In terms of the reaction in the markets, we have some after-hours market data to give us an initial sense of the response to the TVIX announcement. TVIX closed the regular session at 17.01 and was last traded at 17.02 when the news crossed the wire and volume spiked. TVIX initially rose a little more than 1% to 17.26, gave back most of those gains, then rose again as high as 17.31 before finishing the after-hours session at 17.28, up 0.27 or 1.6% from the close.

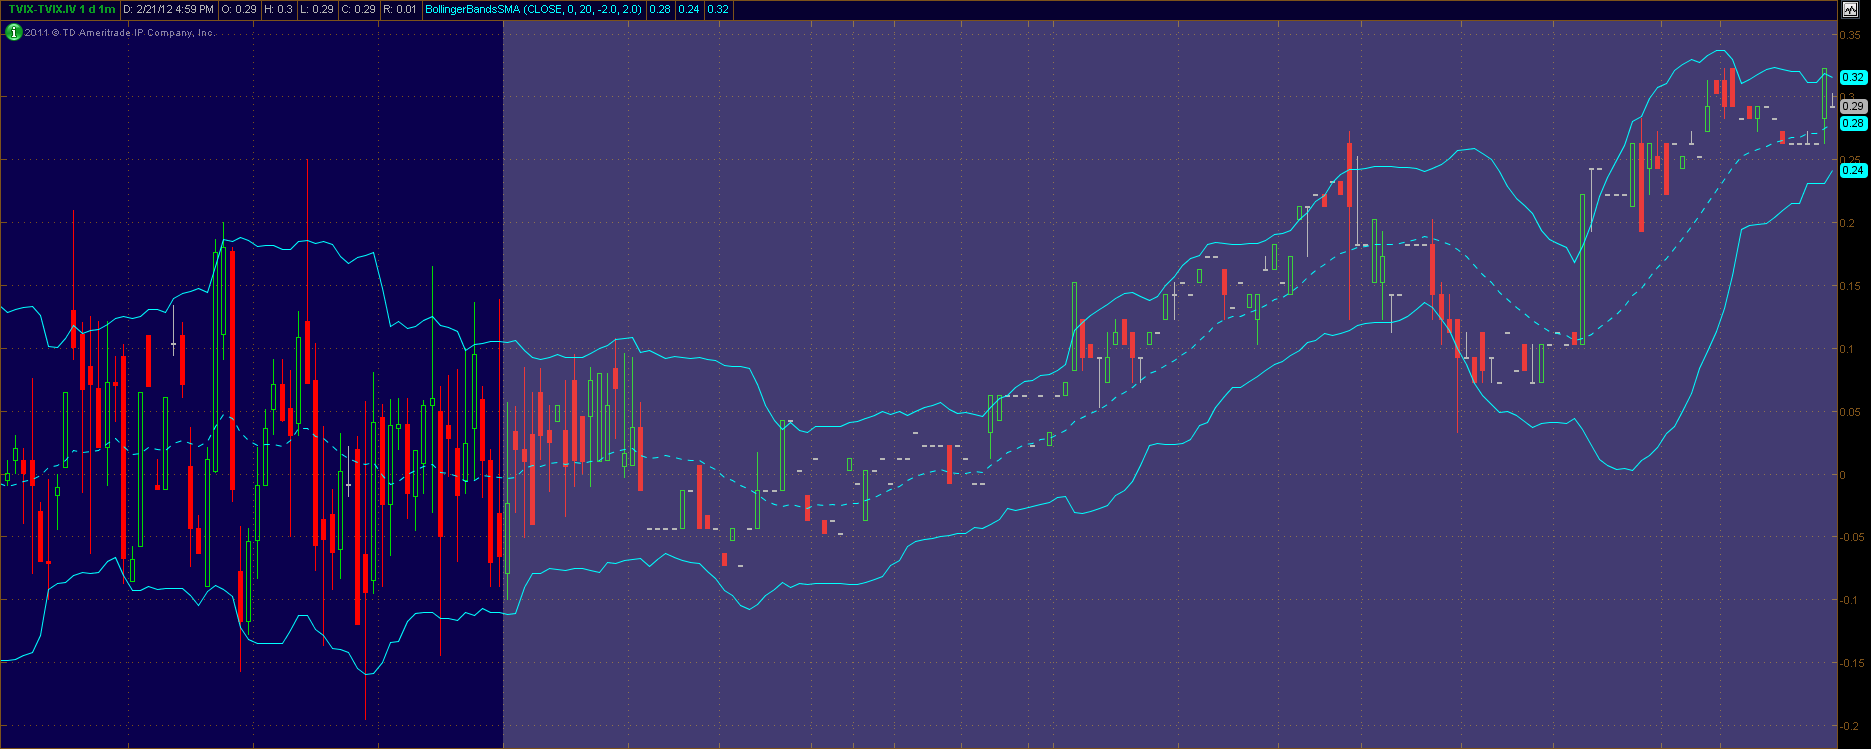
Traders should be aware that each ETP has an Intraday Indicative Value (IV or sometimes IIV), which is essentially a real-time estimate of an ETP’s fair value, based on the most recent prices of its underlying securities. These quotes are updated every 15 seconds and can help determine the extent to which a security has deviated from this measure of fair value. In the graphic below, I have captured the difference between TVIX and TVIX.IV during the last hour of the regular trading session and throughout the (grayed out) after-hours trading session, where TVIX rose to 0.29 above its intraday indicative value.

During tomorrow’s session, keep an eye on TVIX relative to TVIX.IV and also the ratio of TVIX to UVXY. At yesterday’s close, TVIX was trading at a multiple of 2.625 times that of UVXY.

In the short-term, I would expect a small premium to creep in to the price of TVIX, but arbitrage to keep that premium in check. Over the longer term, the price of TVIX will continue to respond to the Four Key Drivers of the Price of TVIX I outlined yesterday, in addition to any market dislocations caused by the suspension of creation units for TVIX.

Should the VIX futures market continue its recent growth trajectory and Credit Suisse ratchet down their relative exposure to that growing market, I would expect to see the resumption of creation units in TVIX in the relatively near future. The timing of this development is difficult to project, as there are quite a few things that can happen in the world of volatility between now and then.

Related posts:

[source(s): thinkorswim/TD Ameritrade]

Disclosure(s): short TVIX, VXX and UNG at time of writing

Friday, May 1, 2009

Short-Covering Rally Data Points

On March 9th I put together a portfolio of ten highly liquid stocks and ETFs that had extreme short interest positions. I posted about this portfolio the next morning in Short-Covering Driving Today’s Gains.

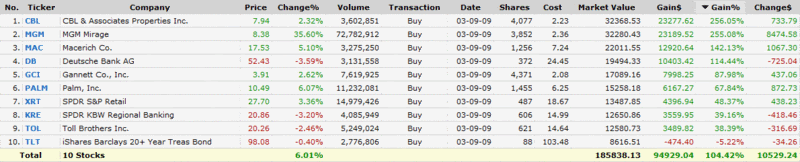
I thought this would be a good time to share the performance of these heavily shorted stocks and ETFs during the course of the past 7 ½ weeks. I have the graphics below from Finviz.com to show how the portfolio has performed. As a bond ETF, TLT probably should not be in the group, but since I included it in the original portfolio, I’m leaving it in here for now. For what it’s worth, removing TLT from the portfolio pushes the total return up to 116.60%. Clearly, a large part of the recent gains have come from short covering the likes of Deutsche Bank (DB), MGM Mirage (MGM), and shopping center REITs Macerich (MAC) and CBL & Associates (CBL).

[source: FINVIZ.com]

Tuesday, March 10, 2009

Short Covering Driving Today’s Gains

One of the best ways to determine how much short covering is behind bear market rallies is to create a portfolio consisting of stocks and ETFs for which there is a large outstanding short interest.

With an eye toward sorting out short-covering activity in a future rally, I put together one such portfolio yesterday, using the Finviz.com screener to identify high volume securities where short positions are a large percentage of the float.

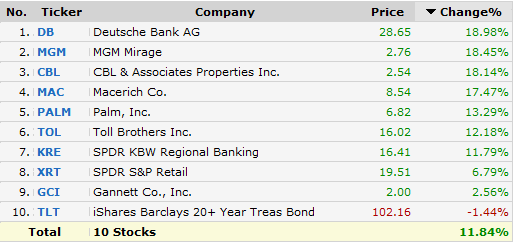
The results are below and show that the ten stocks in this portfolio are up an average of 11.8% halfway through today’s session, suggesting that short covering is fueling a large portion of today’s rally. Note that 7 of the 10 holdings are up more than 11% today, led by Deutsche Bank (DB) and MGM Mirage (MGM).

[source: FINVIZ.com]

Friday, February 20, 2009

Global Bank Stocks in a Post-Lehman World

I get tired of talking about the banks, but it is the story for the foreseeable future. While Citigroup’s (C) common stock flirts with the 2.00 line (can we call it Bank of Mendoza?) and insists it has not had conversations with the government about nationalization, Bank of America (BAC), whose stock is barely above the 3.00 level, is also out saying, “We see no reason to nationalize a bank that is profitable, well capitalized and actively lending.” Add to the financial stew a Wells Fargo (WFC) stock under 10.00 for the first time since 1996 and it is hard not to be obsessed by the banking sector.

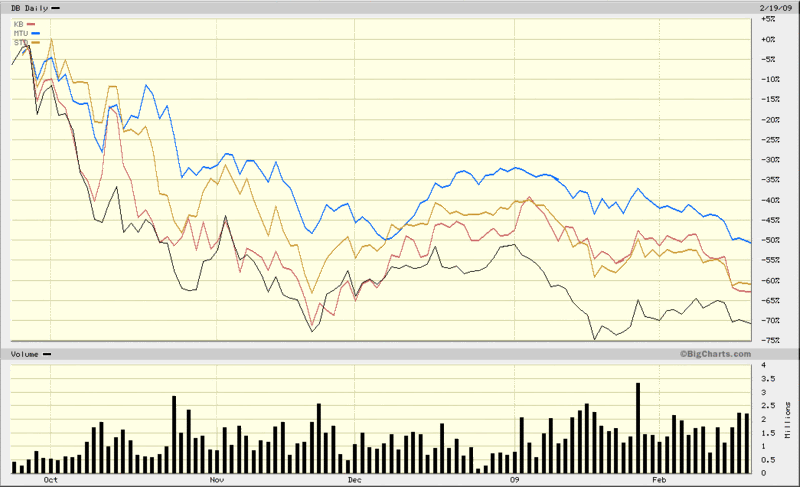
For all the discussion of U.S. banks, I wish to turn to the global scene. Lately U.K. banks and Irish banks have been the target of rumblings about possible nationalization, so I am going to skip over banks from these countries and instead focus on the largest banks in two critical European countries (Germany and Spain) and two critical Asian countries (Japan and South Korea). These four banks are Deutsche Bank (DB), Banco Santander (STD), Mitsibushi UFJ Financial (MTU) and Kookmin Bank (KB). All four banks happen to trade in the U.S. via American Depository Receipts (ADRs).

In the chart below, I have graphed the performance of all four giant banks since the last week in September, when the ripple effects of the Lehman bankruptcy and nationalization of AIG began to be felt across the globe. Not surprisingly, all four banks have seen their stock prices fall by more than 50%, with Deutsche Bank the worst performer among the group and Mitsibushi UFJ Financial feeling the least amount of pain. For comparison purposes, most of the Irish and British banks are down more than 90% during the same period.

The global banking crisis obviously has a long way to go before anyone can say with confidence that it is behind us. In the interim, even a medium-sized bank from a country most U.S. investors are not watching closely can lead to another tipping point that puts the global financial system closer to the brink. Investors seeking to keep a weather eye on global financial firms may also wish to monitor closely the iShares Global Financials ETF (IXG).

[source: BigCharts]

Tuesday, January 20, 2009

U.S. Banking Index More Bearish than November

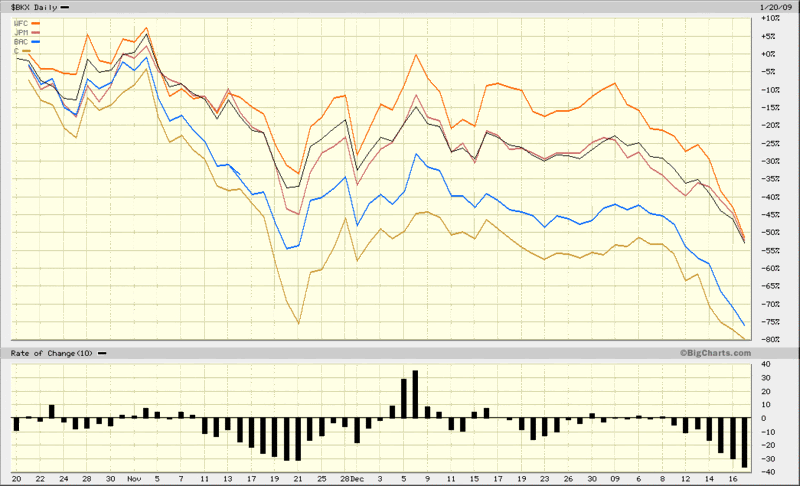
With pressure on banks increasing across the globe and hitting European banks (RBS, AIB, BCS and DB) particularly hard, the U.S. banking sector now finds itself falling faster than it did even at the November lows. State Street Corp. (STT) has been considered one of the safest U.S. banks, yet announced today that profits in the most recent quarter fell 71%, largely as a result of a $6.3 billion loss in its investment portfolio during the quarter.

The chart below shows that the selloff in the banking index (BKX) is sharper now than it was at any time during the November bank panic. While the banking index and most of the large banks are making new lows, the S&P 500 index has managed to draw strength from other sectors to remain above the November lows and even above last week’s low.

The rest of the week should determine whether we have a higher low in the broader indices (my guess) or break below SPX 800 to challenge the November lows.

[source: BigCharts]

DISCLAIMER: "VIX®" is a trademark of Chicago Board Options Exchange, Incorporated. Chicago Board Options Exchange, Incorporated is not affiliated with this website or this website's owner's or operators. CBOE assumes no responsibility for the accuracy or completeness or any other aspect of any content posted on this website by its operator or any third party. All content on this site is provided for informational and entertainment purposes only and is not intended as advice to buy or sell any securities. Stocks are difficult to trade; options are even harder. When it comes to VIX derivatives, don't fall into the trap of thinking that just because you can ride a horse, you can ride an alligator. Please do your own homework and accept full responsibility for any investment decisions you make. No content on this site can be used for commercial purposes without the prior written permission of the author. Copyright © 2007-2023 Bill Luby. All rights reserved.
 
Web Analytics