Showing posts with label short interest. Show all posts

Thursday, April 1, 2010

Some More High Short Interest Stocks

Yesterday’s Short Squeeze Portfolio One Year Later highlighted seven stocks and two ETFs which had extremely high short interest back in early March 2009. Not surprisingly, these stocks have done very well as the market and the economy have turned around.

After having the bulls in chart for some 13 months, is a similarly constructed portfolio using current data a shopping list for bulls or for bears?

Looking at the list below (which includes companies with 30% of the float short, average volumes of at least one million shares per day, as well as additional filters for optionability, minimum market cap, price, etc.), which I assembled after yesterday's close, there is a strong representation of recent high fliers (TLB, SKS) in addition to several stocks that have been underperforming as of late (GDP, STEC, FSYS). Given my bias for shorting weakness rather than strength, I will be looking most closely at the latter group as possible short candidates, while keeping an eye on retailers such as Talbots and Saks as possible buy on the dip candidates until there is better evidence that the consumer – and retail stocks – are suffering from fatigue.

For more on related subjects, readers are encouraged to check out:


[source: FINVIZ.com]

Disclosure(s): none

Wednesday, March 31, 2010

Short Squeeze Portfolio One Year Later

In retrospect, I must have been a fool in February 2009 and a genius in March 2009. From a distance, that is typically what it looks like when I try to call a bottom.

Of course anyone with a dart and a list of stocks could have constructed a portfolio what would return at least 60% a year or so ago, but the tricky part is that so many were reluctant to pull the trigger.

Fortunately, when there was the first whiff of a possible bottom, I was lucky enough to be fishing from a sea of heavily shorted positions and assembled a portfolio of stocks in which at least 30% of the float was short and the average volume in the stock was at least 500,000 million shares. I first unveiled these ideas in Short Covering Driving Today’s Gains on March 10, 2009 and later followed up with a discussion of the performance of that portfolio in Short Covering Rally Data Points on May 1, 2009, at which point the average holding had already more than doubled.

Now, a little more than one year later, four of the holdings (GCI, CBL, MAC, MGM) have gained more than 400%. The two laggards are PALM, down almost 40%, and TLT, the long bond ETF, which is down about 10% after dividends and is omitted from the chart of equities and equity ETFs below.

I believe some of these former short squeeze candidates still have some room to run, but in my next post, I will look at some current heavy short interest plays and see whether the shorts have the odds in their favor this time around.

For more on related subjects, readers are encouraged to check out:


[source: FINVIZ.com]

Disclosure(s): long MAC, DB and XRT at time of writing

Friday, May 1, 2009

Short-Covering Rally Data Points

On March 9th I put together a portfolio of ten highly liquid stocks and ETFs that had extreme short interest positions. I posted about this portfolio the next morning in Short-Covering Driving Today’s Gains.

I thought this would be a good time to share the performance of these heavily shorted stocks and ETFs during the course of the past 7 ½ weeks. I have the graphics below from Finviz.com to show how the portfolio has performed. As a bond ETF, TLT probably should not be in the group, but since I included it in the original portfolio, I’m leaving it in here for now. For what it’s worth, removing TLT from the portfolio pushes the total return up to 116.60%. Clearly, a large part of the recent gains have come from short covering the likes of Deutsche Bank (DB), MGM Mirage (MGM), and shopping center REITs Macerich (MAC) and CBL & Associates (CBL).

[source: FINVIZ.com]

Tuesday, March 10, 2009

Short Covering Driving Today’s Gains

One of the best ways to determine how much short covering is behind bear market rallies is to create a portfolio consisting of stocks and ETFs for which there is a large outstanding short interest.

With an eye toward sorting out short-covering activity in a future rally, I put together one such portfolio yesterday, using the Finviz.com screener to identify high volume securities where short positions are a large percentage of the float.

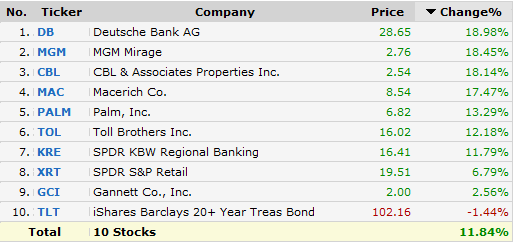
The results are below and show that the ten stocks in this portfolio are up an average of 11.8% halfway through today’s session, suggesting that short covering is fueling a large portion of today’s rally. Note that 7 of the 10 holdings are up more than 11% today, led by Deutsche Bank (DB) and MGM Mirage (MGM).

[source: FINVIZ.com]

Monday, March 10, 2008

Short Interest Screens

There are a number of places on the web that provide short interest. For individual stocks, I am partial to the data at ShortSqueeze.com. Those seeking a broad brush perspective on large short positions and recent changes will likely prefer the short interest highlights from the Wall Street Journal.

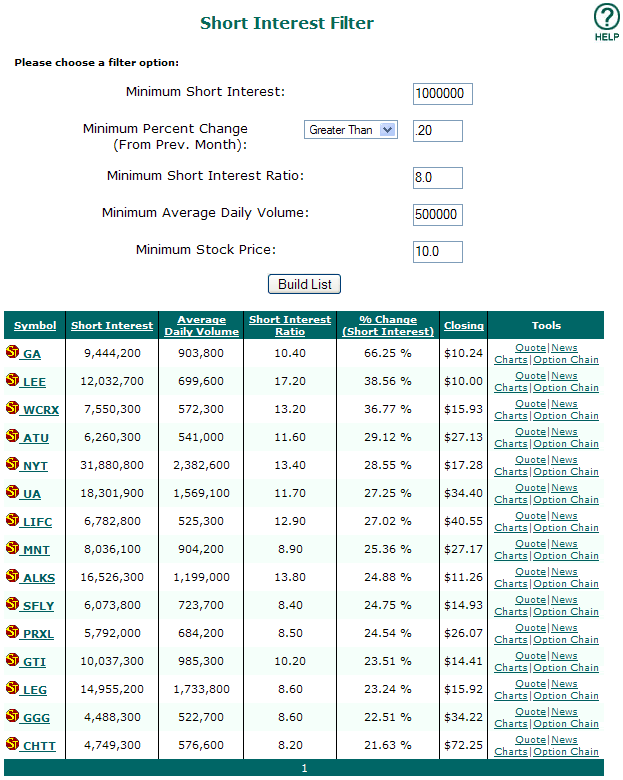
My own favorite is the short interest filter at SchaeffersResearch.com. This tool allows users to input data in five fields (see graph below) and generate a list of stocks that meet the specified criteria. I have created one such list below from the criteria specified in the fields below.

Knowing the short interest and associated trends in a stock can arm individual investors with a sense of the collective hedge fund speculative opinion on a particular security. In markets that are trending down, these are often the stocks that get the most severe Whac-A-Mole treatment. On the other hand, when the markets have one of those inevitable +300 days, look for the biggest gainers to be from the list of most heavily shorted companies with the highest short interest ratios.

DISCLAIMER: "VIX®" is a trademark of Chicago Board Options Exchange, Incorporated. Chicago Board Options Exchange, Incorporated is not affiliated with this website or this website's owner's or operators. CBOE assumes no responsibility for the accuracy or completeness or any other aspect of any content posted on this website by its operator or any third party. All content on this site is provided for informational and entertainment purposes only and is not intended as advice to buy or sell any securities. Stocks are difficult to trade; options are even harder. When it comes to VIX derivatives, don't fall into the trap of thinking that just because you can ride a horse, you can ride an alligator. Please do your own homework and accept full responsibility for any investment decisions you make. No content on this site can be used for commercial purposes without the prior written permission of the author. Copyright © 2007-2023 Bill Luby. All rights reserved.
 
Web Analytics