VIX Narrowly Misses New Consecutive Day Decline Record
After falling for a record-tying ten consecutive days, the VIX narrowly missed setting a new record today when it jumped 0.37 in the 4:00 - 4:15 p.m. ET twilight zone trading period to finish the day at 21.49, +0.06.
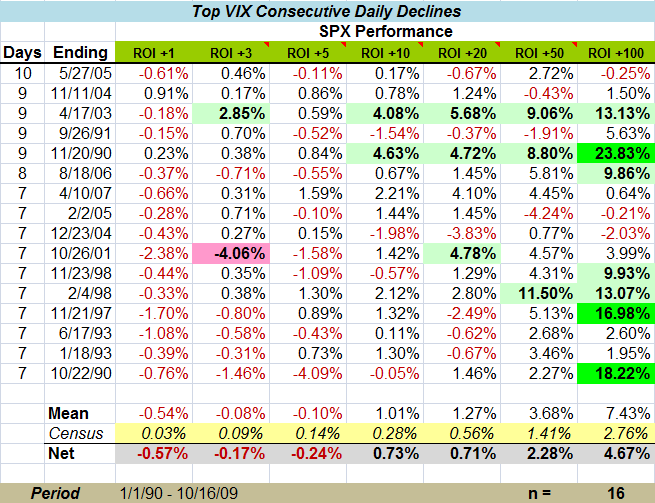
In the chart below, which I borrowed from the subscriber newsletter, I offer some data to help put the current decline in an appropriate historical context. Prior to the streak that ended last Friday, the only other time that the VIX fell for ten consecutive days was in April to May of 2005. At that time, the bull market was just beginning to pause for a month and it was not until six months later that bulls began to reassert themselves.
Looking at the other fifteen instances in which the VIX fell at least seven days in a row, a pattern emerges in which following the VIX streak, the S&P 500 index has a tendency to post a slight loss for a week or so, then significantly outperform the historical averages (“census”) for the balance of the periods studied, from 10 to 100 trading days.
In terms of adding an interpretive narrative, think of a streak of the VIX declining for seven or more days in a row as a signal that the markets are recalibrating volatility expectations and paving the way for further advances in an environment of diminished risk. Of course the caveat is that a week or so of mean reversion (i.e., an increasing VIX and a declining SPX) usually serves as a transition from the streak of VIX declines to an extended period of above-average stock market returns.
For a related post, readers are encouraged to check out Steaking – an early VIX and More classic and also an official lighter side selection.


