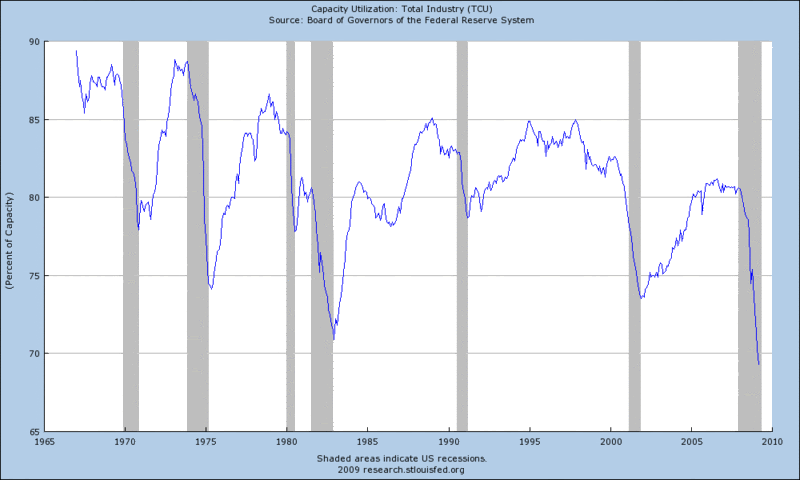
Chart of the Week: Capacity Utilization Sets New Low
I have been bullish since March 5th (SPX at 687; Intermediate Bottom Potential Is High), but a number of factors have turned my bias back to the bearish side in the course of the past few days.
Apart from some technical indicators which suggest equities are overbought at present, there has been a recent wave of economic data, much of it swept under the rug, which suggests that bullish headlines may soon be on the wane. The news spans housing starts to foreclosures to credit card charge-offs to retail sales and industrial production. Frankly, none of it looks promising.
Joined at the hip to the industrial production report is capacity utilization data. Essentially, this statistic measures how much of the national production capacity is being used and how much is sitting idle.
This week’s chart of the week looks at the full history of total capacity utilization in the United States, based on data available from the Federal Reserve. Total capacity utilization for March was just 69.3%. This is the lowest number in the history of this statistical series, which dates back to 1967. While not shown in the graph below, manufacturing capacity utilization fell to 65.8%, which is the lowest number since records were first gathered in 1948.
In terms of interpreting the capacity utilization data, it is probably best to think of the number as a broad measure of demand relative to existing infrastructure. Of course the current record low numbers reflect a historic weakness in demand. Capacity utilization is also a strong predictor of inflationary and deflationary pressures. With so much slack in the system, deflationary pressures are sure to increase as prices get slashed in order to offset the high fixed costs of so much idle productive capacity.
In addition to the current bad news, there are some complicating factors which may make it difficult to reverse the recent trend. Looking ahead, a stronger dollar and weaker consumer does not bode well for future production data – and should raise new concerns about the possibility of deflation.
Industrial production may steal most of the headlines, but capacity utilization is an often overlooked important piece of the economic puzzle.

[source: Federal Reserve]


4 comments:
I agree with your analysis that the markets may be overbought and heading for a short correction (10-15%). Also, although the interpretation of the capacity utilization seems valid, would you also consider that this may be a lagging indicator and will eventually start turning upwards once the sentiment and markets start going up due to the tremendous amount of dollar printing that is going on, which eventually will trickle down in the markets, causing the deflationary pressure to subside? Sorry for the loooong sentence but you see what I mean? Thoughts?
Cheers...Pankaj
I still read you Bill, but major events--that i wont get into now--occured and took over my entire life.
i continue in markets. bought SRS on the open 29.35~.42, having finally sold SLW which i held all winter, selling calls each month, and adding over time 10% to my position... if i had stayed long QID a few more weeks, i would have done far better, but instead of 110/120% from early September, i am maybe 10% up since then--still better than most.
i am was imboldened late last night, in making my final check, by your VIX/VXN ratio... i dont even recall how it works (of course, know you described it clearly), but simply stopped by and there it was, *BING*, good enough for me.
i know that you dont F*%K around.
warmly, dk
Man, already back up to 38. I think my range top of 40 won't hold, based on this action. I called away on business today, so I missed the morning move. I didn't want to open orders over the weekend. Ugh.
Still holding GLL, but I got small on Friday 20% of initial position, which I will add to after this run-up fades.
Long SDS, TZA, GLL. Waiting to get long Platinum (it is falling, thankfully). If I can get PLAT:GOLD back to 1.2, I will be a very happy man.
I'm a little late getting around to these comments, but hopefully it's better than not responding at all.
Pankaj,
I think most of the manufacturing data are lagging indicators, but they probably lag by less than some that get more attention, such as employment. I expect we are more likely to see turns in retail spending and/or housing before manufacturing, but if there are signs of an upturn in manufacturing, the response should be substantial.
dk,
Glad to see you back in the fold -- and hopefully managing life events rather than vice versa.
I try to keep my various market calls to a minimum -- and am partial to speaking up when I am in the minority.
Eric,
I have since sold a bunch of the VIX May 37.5 calls. I am less bearish on the markets and think that even if the markets go down from here, that volatility will probably not rise much, if at all.
Cheers,
-Bill
Post a Comment