Showing posts with label capacity utilization. Show all posts

Thursday, August 19, 2010

Looking Under the Hood of the Philly Fed Index Report

After mentioning the positive surprise in the July industrial production and July capacity utilization numbers in yesterday’s Industrial Production and Capacity Utilization Since 1988, it is only fair to note that today’s Philly Fed index painted a much uglier picture of the manufacturing landscape.

Officially known as the Philadelphia Fed’s Business Outlook Survey, the Philly Fed index is derived from a monthly survey of manufacturers in the Third Federal Reserve District, which is comprised of Delaware, the southern half of New Jersey and all of Pennsylvania except for about the westernmost quarter of the state. Manufacturers are asked to indicate the direction of change in overall business activity and in the various measures of activity at their plants: employment; working hours; new and unfilled orders; shipments; inventories; delivery times; prices paid; and prices received.

The results of these surveys are used to create a regional ‘diffusion index,’ which is essentially the percentage of respondents who see an increase in activity minus the percentage of respondents who see a decrease. Respondents are asked to evaluate both current activity (current month versus last month) and their expectations for future activity (six months from now versus current month.)

The number that hits the headlines is a composite ‘general activity’ index covering all aspects of current activity. Today that number was -7.7, down from +5.1 in July. The number that rarely is reported is the future ‘general activity’ index, which fell from +25.0 to +19.6. (see press release and summary of returns table for additional details)

The chart below captures 15 years of both the current and future general activity data, with recessionary periods shaded in gray.


I also like to look at some of the component data. Three of my favorites are new orders for a glimpse into the future, shipments for a sense of the current level of economic activity and employment, particularly given the heightened sensitivity to this issue and the need for wages to help repair the consumer balance sheet. The chart below captures all three of these components of the general activity index in the same format (percentage of respondents reporting an increase in activity minus those reporting a decrease.)


The chart shows that while new orders have slipped from July to August, manufacturers in the Philadelphia area are still optimistic about an increase in orders six months from now and are even more optimistic this month than last month, reversing a declining trend. Shipments have also showed a decline from July to August, but again, respondents are optimistic about the situation six months from now.

What really got my attention was the employment diffusion index, which shows relatively flat current employment from May to the present, but fairly significant declining expectations about employment six months from now. In fact, expectations are now for a slight decline in employment six months from now – the first time that manufacturers have been expecting a net decline in employment in over a year.

Related posts:

[source: Federal Reserve Bank of Philadelphia]

Disclosure(s): none

Wednesday, August 18, 2010

Industrial Production and Capacity Utilization Since 1988

After a streak of some lean economic data, the bulls were rewarded with a positive surprise in both the July industrial production and July capacity utilization numbers yesterday, both of which exceeded expectations and topped the June levels.

The chart below captures both measures of manufacturing activity going back to 1988 and shows that manufacturing appears to be continuing as one of the strengths of the recovery. While the chart captures monthly changes, it is important to point out that total industrial production in July was 7.7% above July 2009 levels, with utilities up 8.2% during the year, followed by 7.7% gains in manufacturing and a 7.5% advance in mining. Just as impressive, capacity utilization has increased in 12 of the past 13 months, gaining 0.7% in July after a flat June.

Related posts:


[source: Federal Reserve]

Disclosure(s): none

Sunday, April 19, 2009

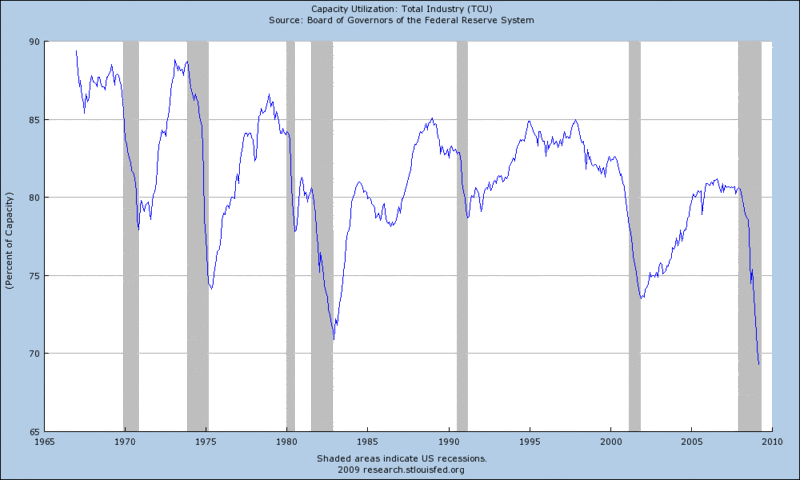
Chart of the Week: Capacity Utilization Sets New Low

I have been bullish since March 5th (SPX at 687; Intermediate Bottom Potential Is High), but a number of factors have turned my bias back to the bearish side in the course of the past few days.

Apart from some technical indicators which suggest equities are overbought at present, there has been a recent wave of economic data, much of it swept under the rug, which suggests that bullish headlines may soon be on the wane. The news spans housing starts to foreclosures to credit card charge-offs to retail sales and industrial production. Frankly, none of it looks promising.

Joined at the hip to the industrial production report is capacity utilization data. Essentially, this statistic measures how much of the national production capacity is being used and how much is sitting idle.

This week’s chart of the week looks at the full history of total capacity utilization in the United States, based on data available from the Federal Reserve. Total capacity utilization for March was just 69.3%. This is the lowest number in the history of this statistical series, which dates back to 1967. While not shown in the graph below, manufacturing capacity utilization fell to 65.8%, which is the lowest number since records were first gathered in 1948.

In terms of interpreting the capacity utilization data, it is probably best to think of the number as a broad measure of demand relative to existing infrastructure. Of course the current record low numbers reflect a historic weakness in demand. Capacity utilization is also a strong predictor of inflationary and deflationary pressures. With so much slack in the system, deflationary pressures are sure to increase as prices get slashed in order to offset the high fixed costs of so much idle productive capacity.

In addition to the current bad news, there are some complicating factors which may make it difficult to reverse the recent trend. Looking ahead, a stronger dollar and weaker consumer does not bode well for future production data – and should raise new concerns about the possibility of deflation.

Industrial production may steal most of the headlines, but capacity utilization is an often overlooked important piece of the economic puzzle.

[source: Federal Reserve]

DISCLAIMER: "VIX®" is a trademark of Chicago Board Options Exchange, Incorporated. Chicago Board Options Exchange, Incorporated is not affiliated with this website or this website's owner's or operators. CBOE assumes no responsibility for the accuracy or completeness or any other aspect of any content posted on this website by its operator or any third party. All content on this site is provided for informational and entertainment purposes only and is not intended as advice to buy or sell any securities. Stocks are difficult to trade; options are even harder. When it comes to VIX derivatives, don't fall into the trap of thinking that just because you can ride a horse, you can ride an alligator. Please do your own homework and accept full responsibility for any investment decisions you make. No content on this site can be used for commercial purposes without the prior written permission of the author. Copyright © 2007-2023 Bill Luby. All rights reserved.
 
Web Analytics