Showing posts with label stock of the week. Show all posts

Monday, August 5, 2013

Updates for Newsletter/Stock of the Week and EVALS; Launch of New Investment Management Business

Just a quick note to inform readers that I recently provided updates and some performance data for the VIX and More Newsletter and also for the EVALS model portfolio service:

Please note that going forward I will no longer be publicly updating performance data for EVALS or for the Stock of the Week due to a variety of factors related to the launch of my new investment management business. I will continue to offer the newsletter, which will still include the Stock of the Week selection; I will also continue to offer the EVALS model portfolio service and will be pleased to discuss current performance data privately. As soon as the launch of my new investment management business is finalized, I will highlight some of the particulars in this space.

Posting on the VIX and More blog should not be affected by any of these changes. In fact, I pledge to resume a more regular posting schedule in the weeks and months ahead.

Sunday, April 3, 2011

VIX and More Newsletter Celebrates Third Anniversary

Today’s publication of the VIX and More Newsletter marks the third anniversary of the launch of this newsletter, which was launched on the heels of the demise of Bear Stearns amidst increasing concerns about the stability of the financial system and increasing market volatility.

Three years later the newsletter has definitely found its voice and represents a more detailed discussion of geopolitical and macroeconomic events than can be found here as well as some broader perspective on the full range of asset classes and issues related to volatility.

Rather than clutter up this blog, I have an entire blog dedicated to the newsletter, as well as the model portfolios and Stock of the Week ‘Sequential Portfolio’ (yes it really is up 1918% in its first 2 3/4 years) information I discuss in the newsletter each week: VIX and More Subscriber Newsletter Blog.

Disclosure(s): none

Friday, April 23, 2010

Content Update

Lately this blog has been unusually quiet, but there is still a lot going on with VIX and More in other locations, with blog content soon to ramp up again to almost daily postings starting next week.

First, for those who may have missed it, Michael Stokes at MarketSci recently ran a three-part series on the VIX and More Stock of the Week ‘Sequential Portfolio,’ which is part of my weekly subscriber newsletter. I posted about the MarketSci review of the SOTW in MarketSci on the Stock of the Week ‘Sequential Portfolio,’ but did not mention two follow-up articles about the SOTW that completed the MarketSci series. The full series is as follows:

Before I leave the SOTW, I should note that this week’s selection, Xyratex (XRTX) had a very solid week, recovering from a down day on Monday to post a 10.7% gain for the week. This brings the cumulative performance of the SOTW to +1145% since the March 30, 2008 inception.

In related news, I recently posted my quarterly update to the VIX and More Subscriber Newsletter Blog to summarize enhancements made to the subscriber newsletter during the first quarter and to discuss the results of three model portfolios I maintain, in addition to the SOTW. The news is all positive and is detailed in Newsletter and Portfolio Performance Update for 3/31/10.

I have also posted a quarterly update to the VIX and More EVALS Blog. EVALS is short for ETF Volatility Analysis Long/Short and reflects an approach to trading ETFs that relies primarily on volatility-based signals. For more information, try EVALS Q1 2010 Update.

Last but not least, Monday marked the publication of the second issue of Expiring Monthly: The Option Traders Journal. This electronic magazine has generated a fair amount of buzz and very positive feedback. I have attached a graphic of the Table of Contents for the April issue below. For the April edition, I contributed an article on selling vertical spreads as well as an ongoing graphical look at the options world we call Charting the Market. More information is available at http://www.expiringmonthly.com/.

As an aside, while I still consider myself to be a full-time trader, in my not-so-abundant ‘free’ time I am also rewriting portions of Trading with the VIX: How to Use Fear, Volatility and Sentiment to Enhance Trading. The folks at Wiley have been very patient with this process, but the time has come to step up my efforts to complete the manuscript. I will do my best to keep the new content flowing at VIX and More, hopefully on an almost daily basis, but the book deserves – and will receive – the bulk of my prose attention going forward.

For more on related subjects, readers are encouraged to check out:


[source: Expiring Monthly]

Disclosure(s): I am one of the founders and owners of Expiring Monthly

Wednesday, April 14, 2010

MarketSci on the Stock of the Week ‘Sequential Portfolio’

In case anyone missed it, I thought I should highlight an excellent discussion of the Stock of the Week ‘Sequential Portfolio’ by Michael Stokes at MarketSci. In my opinion, Michael’s blog is required reading for anyone who is interested in a technical discussion of trading systems and approaches to developing trading strategies. Frankly, I was delighted that he decided to put the Stock of the Week (SOTW) through the paces.

MarketSci’s Review of the VIX & More Stock of the Week examines performance based on a buy at the open at the beginning of each week and a sell at the close each Friday. This is different from the Friday close to Friday close data I have always reported in my subscriber newsletter, because I always wanted to report a cost basis in the newsletter on Sunday and assumed that if I avoided stocks which had news over the weekend, the difference between using a Friday close vs. a Monday open as a cost basis would not be meaningful in the long run.

For the first year or so, the difference between Friday’s close and Monday’s open was not meaningful. During the rally from the March 2009 bottom, however, a good portion of the gains for stocks have come on Mondays. Earlier this week, Business Week cited data from Bespoke Investment Group which attributes all of the gains in stocks over the course of the past six months to Mondays, with 80% of all Mondays being up days during this period.

In addition to the rise of ‘Magic Mondays,’ the SOTW also was prescient enough to flag Bell Microproducts (BELM) as a SOTW selection the day before Avnet (AVT) agreed to acquire the company for a 29.2% premium over Friday’s closing price two weeks ago. Unfortunately, the acquisition was announced before BELM opened for trading on Monday. After some deliberation, I included the acquisition-related gains in the performance data rather than rewrite the rules for tracking the performance of this portfolio after nine quarters of adhering to one set of standard practices.

By all means, click through and see what MarketSci has to say about the Stock of the Week. By his calculations, a Monday to Friday holding period has yielded a 103.9% annualized return during a period in which the S&P 500 index has lost money. While a one stock ‘portfolio’ can hardly be considered anything less than high risk, I was also pleased to see the stellar 1.83 Sharpe ratio, which is a standard measure of risk-adjusted performance.

For the record, this week’s SOTW selection, UFS, is up 4.3% for the first three trading days of the week. Last week, IPSU delivered an 8.7% return for the week. (Both calculations utilize Friday’s closing price as the cost basis.)

For more on related subjects, readers are encouraged to check out:

…or pay a visit to the VIX and More Subscriber Newsletter Blog and the most recent post, Newsletter and Portfolio Performance Update for 3/31/10.

Disclosure(s): long UFS and IPSU at time of writing

Sunday, October 11, 2009

Chart of the Week: Two Bull Legs and Counting…

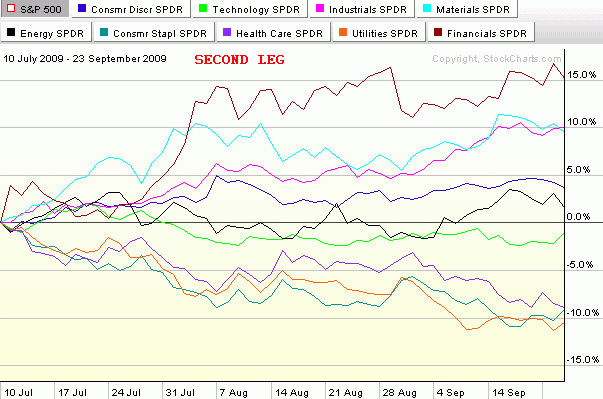
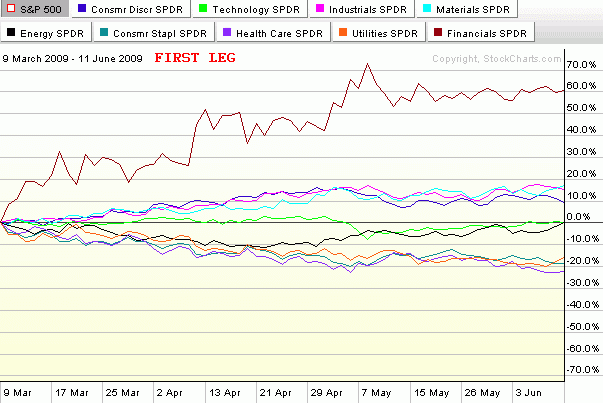
In the seven months since stocks bottomed and rallied some 61% (in the SPX) to current levels, there have been two distinct bull legs. The first leg began with the low close on March 9th (or intraday low on March 6th) and lasted just a little more than three months until the high close on June 11th. After a one month downturn, the second bull leg was launched on July 10th and persisted almost two and one half months until September 23rd. This time the pullback appears to have been more short-lived and has a provisional end date of October 2nd.

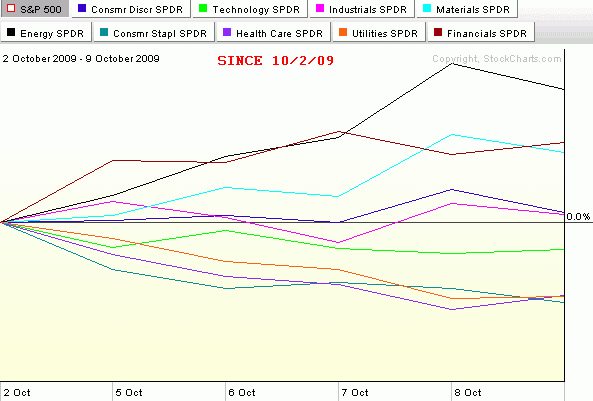
The three charts below – which collectively form this week's chart of the week – capture the sector performance relative to the SPX (the numbers are not in absolute terms) for the first two bull legs and also throws in the first week of what may turn out to be a third bull leg.

Note that in the first two bull legs, financials (XLF) were easily the top performing sector in both instances. Also, on both occasions it was the materials (XLB) and industrial (XLI) sectors that had clear separation from the rest of the sectors and were almost neck and neck for second and third. These three sectors clearly represent a top tier in terms of performance during the most pronounced 2009 bull moves. A second tier of consumer discretionary (XLY), technology (XLK) and energy stocks (XLE) has generally performed slightly above the baseline SPX. The bottom tier consists of three defensive sectors that typically only outperform the SPX in market downturns. In fact, these three sectors, health care (XLV), consumer staples (XLP) and utilities (XLU), were the top three performers during the June 11th to July 10th pullback.

Just for fun, I have added the last week of performance in the bottom chart. It is too early to draw conclusions for one week of upward movement, but so far the leading sector for October is energy. If the markets are to continue to set new highs for 2009, a big question will be whether the same sectors continue to lead or whether new leadership emerges. Personally, I do not expect that the same performance hierarchy that has characterized the last two bull legs to continue during the next month or two of upward moves. In fact, I would expect leadership to shift to the second tier in the form of technology, energy or consumer discretionary stocks. No matter what happens, it will be interesting to see how the broader market performs if financials start to lag the other sectors.

[source: StockCharts]

Monday, June 15, 2009

Stock of the Week Winning Streak Ends at 13 Weeks

It was a fun ride while it lasted, but the Stock of the Week (SOTW) winning streak finally came to an end last week, after 13 consecutive weekly winning selections. In the end, it was a scant 0.14 weekly decline in LSB Industries (LXU) that brought an end to the ride, but even with that loss, the SOTW ‘Sequential Portfolio’ is still up 136.9% so far for 2009 and a gravity-defying 368.4% in the 14 ½ months since I introduced that feature as a part of my subscriber newsletter.

For anyone who is interested, I will update the performance of the SOTW in another two weeks and at the end of each quarter on the VIX and More Subscriber Blog.

For more information on the Stock of the Week, try VIX and More Stock of the Week Selection Up 343% in 14 Months.

Monday, June 8, 2009

Stock of the Week Winning Streak Hits 13 Weeks

At the end of May, in VIX and More Stock of the Week Selection Up 343% in 14 Months, I promised to post future Stock of the Week (SOTW) selections here on the blog one day after I flagged them in the subscriber newsletter as long as the string of consecutive winning weeks remained intact. With the 3.5% gain in last week’s selection, Tech Data (TECD), the weekly winning streak is now up to 13 weeks.

This week’s SOTW, geothermal and water source heat pump manufacturer LSB Industries (LXU), lost 0.02 today and dropped the cumulative return since the 3/30/08 inception down to 371%.

Should LXU manage to rally and post a gain for the week, I will carry this feature forward until the SOTW winning streak is broken.

Until then, I am partial to riding the hot hand and seeing where it takes me.

Tuesday, June 2, 2009

Stock of the Week Update (+362%)

Last week, in VIX and More Stock of the Week Selection Up 343% in 14 Months, I promised to post on the blog the current Stock of the Week selection as long as the winning streak (now at 12 weeks and counting) continues.

First, to get caught up with last week’s business, Core-Mark Holding Company (CORE), finished last week up 14.4%. This week’s selection, Tech Data (TECD) posted a 1.4% gain yesterday, bringing the cumulative 14 month return of the Stock of the Week ‘Sequential Portfolio’ to +362.87%.

Tuesday, May 26, 2009

VIX and More Stock of the Week Selection Up 343% in 14 Months

When I launched the VIX and More Subscriber Newsletter in March 2008, I promised myself that I would reference the newsletter infrequently and continue to devote the majority of my time and effort to generate the type of charts and analysis that were not available elsewhere in the public domain.

Keeping church and state separate is not always an easy thing, but last month when a long-time friend and frequent visitor to the blog discovered that I had been publishing a newsletter for over a year without his knowledge, he expressed his surprise and some disappointment at my ability to keep the newsletter a secret.

In an effort to undo some of the secrecy, I thought I would highlight one of the weekly features of the newsletter which has become my wife’s favorite as well as the favorite of a number of readers. I call it my Stock of the Week (SOTW) ‘Sequential Portfolio.’ Calling it a portfolio may be a bit of a stretch, because the self-imposed rules state that each week the entire portfolio is invested in a single stock that is purchased at the beginning of the week and sold at the end of the week, regardless of performance. I like to think of it as an equity relay race of sorts. If one stock stumbles or tires, there is always another one to take the baton just around the next turn.

The intent of the SOTW is to highlight a single stock each week, usually somewhat off of the beaten path, which I believe is worth owning for both fundamental and technical reasons. While all positions are long-only and are limited to one week, the purpose of the SOTW is not to encourage readers to hop on a single stock and ride it for a week, but rather to generate a new idea each week that might be a candidate for further investigation and perhaps an extended holding period.

The reason I decided to post about the Stock of the Week here and now is that the cumulative return for this long-only single stock portfolio is now +343.2% since I introduced the idea in my first subscriber newsletter some 14 months ago. During that period, the benchmark S&P 500 index is down some 31.7%.

Since the SOTW has reeled off eleven consecutive winning weeks and is already up 11.1% this week as a result of as a result of a big move today in this week’s selection, Core-Mark Holding Company (CORE), I have henceforth decided to post the weekly selection after the first day of trading each week, as long as the winning streak continues.

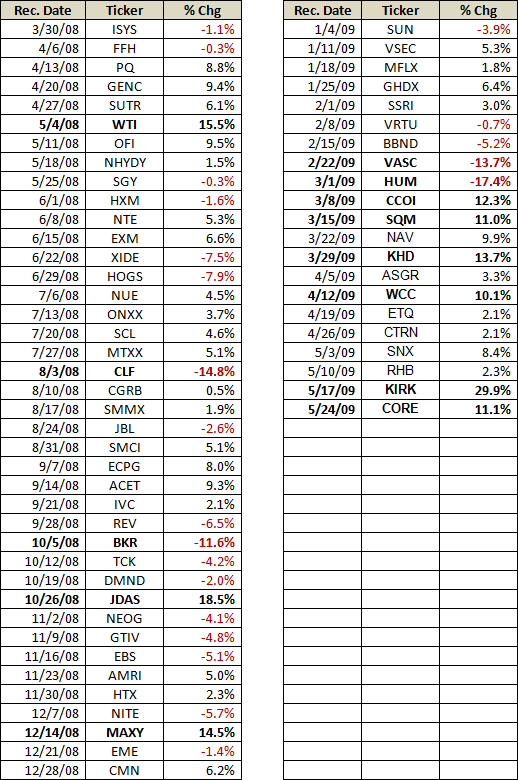
For those who are interested, I have posted the entire history of the SOTW selections below.

Note that stock selection is not the primary focus of the newsletter. Instead, there are nine regular weekly features, as follows:

  1. The Week in Review: What Moved the Markets
  2. Market Commentary
  3. The Week Ahead: What to Look For
  4. Market Sentiment (using a proprietary Aggregate Market Sentiment Indicator)
  5. Volatility Corner (discusses the VIX and other volatility indices/products such as VXV, VXX, a proprietary Global Volatility Index, etc.)
  6. Asset Class Outlook (short, intermediate, and long-term outlook for ten asset classes)
  7. Current Investment Thesis
  8. VIX and More Focus Model Portfolios (Growth and Foreign Growth)
  9. Stock of the Week

For more information about the VIX and More Subscriber Newsletter and the 14 day free trial that I offer, check out the VIX and More Subscriber Newsletter blog.
[source: VIX and More]

DISCLAIMER: "VIX®" is a trademark of Chicago Board Options Exchange, Incorporated. Chicago Board Options Exchange, Incorporated is not affiliated with this website or this website's owner's or operators. CBOE assumes no responsibility for the accuracy or completeness or any other aspect of any content posted on this website by its operator or any third party. All content on this site is provided for informational and entertainment purposes only and is not intended as advice to buy or sell any securities. Stocks are difficult to trade; options are even harder. When it comes to VIX derivatives, don't fall into the trap of thinking that just because you can ride a horse, you can ride an alligator. Please do your own homework and accept full responsibility for any investment decisions you make. No content on this site can be used for commercial purposes without the prior written permission of the author. Copyright © 2007-2023 Bill Luby. All rights reserved.
 
Web Analytics