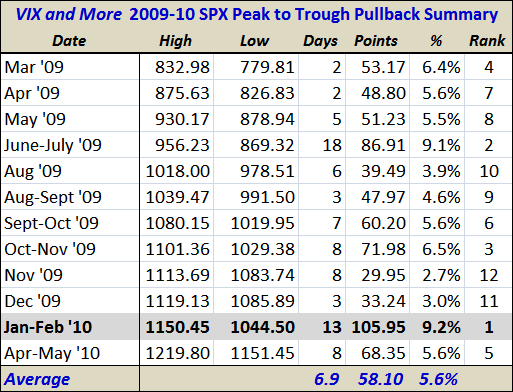
S&P 500 Index Correction at Post-March ’09 Average of 5.6%
A few minutes ago the S&P 500 index made an intraday low of 1151.49. While it remains to be seen whether this line in the sand will hold, it is important to note that the SPX is now 68.35 points below the high water mark of 1219.80 from April 26th. This means the index has corrected 5.6%, which is exactly the average (mean) pullback over the course of the past 14 months
The table below summarizes the 12 most significant pullbacks since stocks bottomed in March 2009. In percentage terms, the current pullback ranks 5th out of 12. Note that the pullbacks ranked fifth through eighth are all clustered around the 5.6% average.
Ultimately, the significance of a 5.6% pullback pales in comparison to fundamental issues surrounding Greece, Portugal and Spain (where the investors should pay the most attention), but given that 1150 also happens to be the high that preceded the January-February 9.2% pullback, the largest pullback since the bull market began, support in the area of 1150 to 1151 should be taken very seriously.

Disclosure(s): none

