Showing posts with label headwinds index. Show all posts

Thursday, August 21, 2008

Headwinds Index Turns Up

Unless you are Usain Bolt, you are not likely to be in top form – not to mention setting world records – running into a headwind. For that reason, last month I developed something I call the Headwinds Index to calibrate the extent to which oil prices and concerns about financial institutions are providing a drag on stock prices.

In keeping with my desire for simplicity wherever possible, the Headwinds Index is calculated as the price of crude oil divided by the financial sector ETF (XLF). For various reasons, I used the USO crude oil ETF instead of the crude oil front month futures.

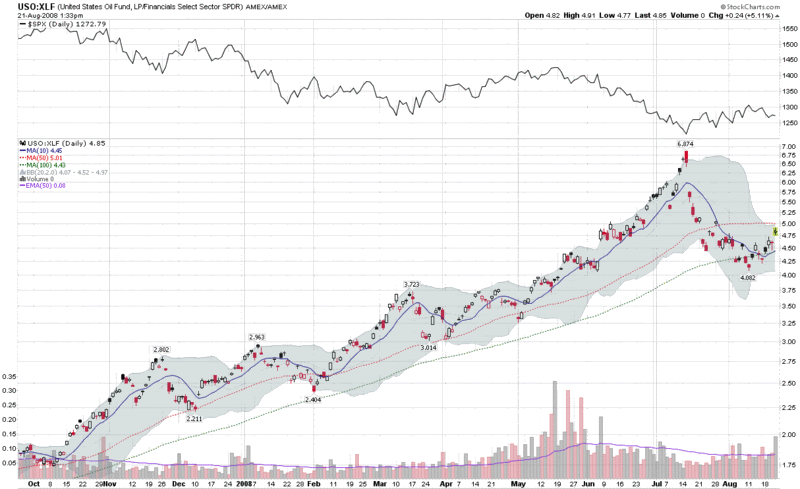
The resulting ratio chart, which I have enhanced from the previous iteration presented in Headwinds Index: How Long Can Financials Outperform Energy? now includes a 100 day simple moving average for the USO:XLF ratio and a 50 day SMA for the SPX mini-graph at the top. [I have also inverted the ratio to better align with the headwinds metaphor.] Note that the 100 day SMA served as support for the Headwinds Index last week and the current level is at the 50 day SMA, which is a potential area of resistance. If this index breaks above 5.0, I would expect to see a rush to re-implement many of those long oil and short financials momentum trades.

Finally, note that an upturn in the Headwinds Index has preceded a turnaround in a rising SPX on a number of occasions. Keep an eye on this divergence going forward, as I do not expect to see a sustained rally in the S&P 500 until financials are able to outperform energy on a relative basis.
Thursday, July 24, 2008

Headwinds Again?

I was traveling today and missed all of the market action. It certainly looks like it was an interesting day, as the headwinds index showed a turn back toward the old long energy and short financials trade. True the energy sector did not rise today (all nine of the AMEX sector SPDRs were down), but it did show some signs of stabilizing.

When I need to get caught up on the best of blogland, the first place I visit is Abnormal Returns, which has a knack for consistently cherry picking the best of what is out there.

For those who need a VIX fix, look no further than Adam of Daily Options Report in That Old VIX Magic, and long-time favorite Michael Stokes of MarketSci.com, whose The VIX Isn’t Magical is a can’t miss article today.

Note that Michael Stokes is one of many to weigh in on the question I posed on Monday: Does the VIX Have Market Timing Value? Check out the comments section for some interesting give and take from a wide variety of ably articulated perspectives, including a recent take from the highly skewed Kurt Osis…

I should be back at it tomorrow, same time, same channel, probably long natural gas and short the banks, maybe even nibbling on a few more VIX calls.

Wednesday, July 23, 2008

Headwinds Index: How Long Can Financials Outperform Energy?

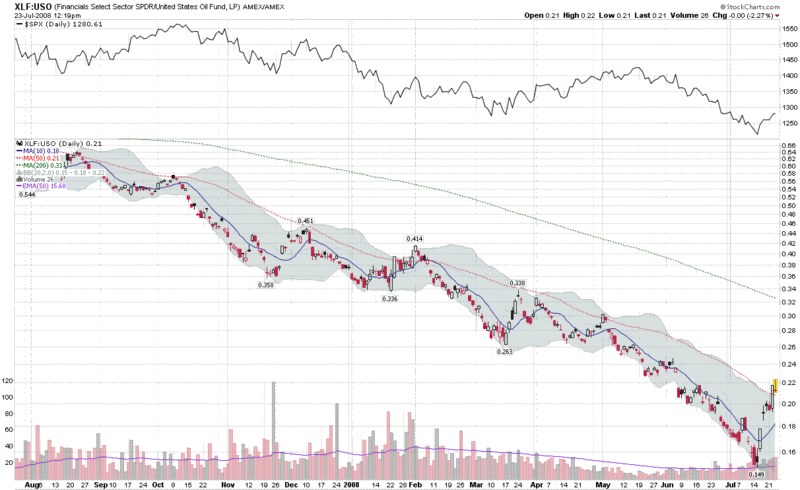
Two weeks ago, I introduced something I called the headwinds index, a simple ratio of financials (XLF) to oil (USO). It took another week for that index to bottom and the markets to rally, but since that bottom, financials have jumped 37% while crude oil has fallen 14% from its peak. The headwinds have turned into a strong tailwind, at least for the past six days.

The question, of course, is how long financials can continue to gain ground before a new long oil, short financials trade becomes too attractive to pass up. Several of my indicators suggest that the tailwinds are about to dissipate in the next day or two; after a strong opening, today’s developing gravestone doji also calls into question the staying power of the recent trend reversal.

At a minimum, I suspect the new tailwinds have gotten ahead of themselves. When they start to move back in the wrong direction, there is little reason to remain in the long financials, short oil trade past its useful life. As sailors are fond of saying, “tack on a header!”

Tuesday, July 8, 2008

Headwinds Index: Financials (XLF) vs. Oil (USO)

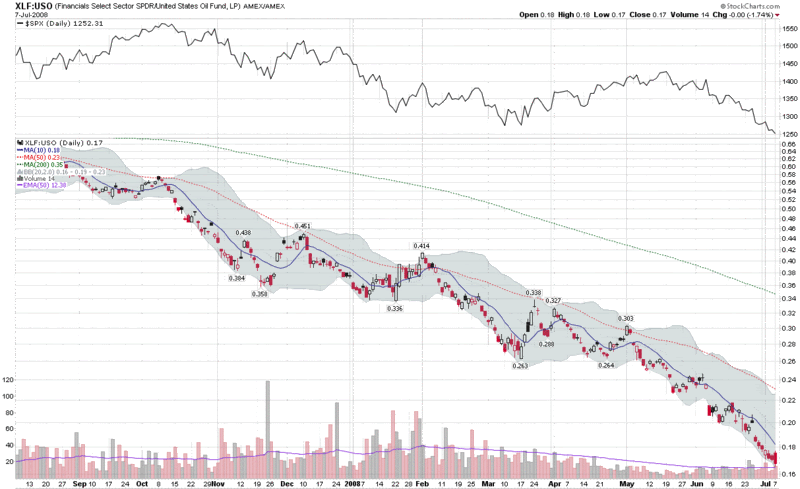
Two numbers have been moving consistently in the wrong direction for the US economy during the past few months: oil prices and bank loan portfolio quality.

The chart below, which reflects a ratio of the valuation of financials (XLF) to crude oil prices (per the USO ETF), neatly captures the recent double threat posed by trends in these two sectors.

You can make an excellent argument that a bottom will not be in until at least one of the two trends, probably both, have reversed. My thinking is that the XLF:USO ratio chart is an excellent tool to monitor those two trends and pinpoint the turnaround. At the very least, I consider the XLF:USO ratio to be a reasonable proxy for two of the major headwinds that the markets are grappling with.

DISCLAIMER: "VIX®" is a trademark of Chicago Board Options Exchange, Incorporated. Chicago Board Options Exchange, Incorporated is not affiliated with this website or this website's owner's or operators. CBOE assumes no responsibility for the accuracy or completeness or any other aspect of any content posted on this website by its operator or any third party. All content on this site is provided for informational and entertainment purposes only and is not intended as advice to buy or sell any securities. Stocks are difficult to trade; options are even harder. When it comes to VIX derivatives, don't fall into the trap of thinking that just because you can ride a horse, you can ride an alligator. Please do your own homework and accept full responsibility for any investment decisions you make. No content on this site can be used for commercial purposes without the prior written permission of the author. Copyright © 2007-2023 Bill Luby. All rights reserved.
 
Web Analytics