Showing posts with label CPCI. Show all posts

Thursday, December 10, 2009

Put to Call Ratio and the Probability of a Downturn

In the last day or two I have been fielded several questions about put to call ratios. It seems as if some investors are concerned that there is a stealth movement by sophisticated investors who are making substantial bets on a downward move with large purchases of puts. Invariably, these concerns have led to questions about what I see in the put to call ratios that will confirm or deny this.

To quickly recap, the CBOE publishes three put to call ratios. In my preferred charting site, StockCharts.com, these are known as:

  • $CPCE – the ticker for the equity put to call ratio
  • $CPCI – the ticker for the index put to call ticker
  • $CPC – the ticker for the total equity + index data

For reasons I have discussed in the past, I prefer the CPCE ratio and use this as a contrarian signal. The problem with the CPCI data is that institutional order flow for index options tends to come in large chunks that can create misleading short-term signals.

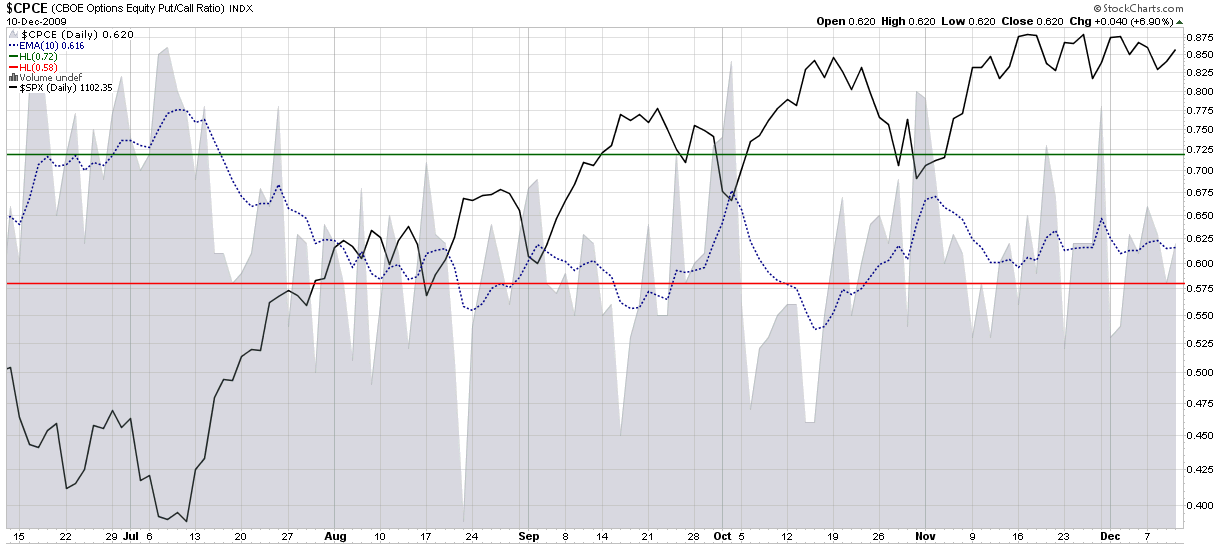
Recently, however, the CPCE, CPCI and CPC have all had very similar looking charts. I have reproduced the six month chart of CPCE below and it shows no unusual spikes in put activity relative to call activity. If anything, the 10 day EMA that I use to smooth the sometimes noisy CPCE data shows an almost eerie flat line for the past month or so, just as was the case when I last wrote about put to call ratios when in Equity Put to Call Ratio Not Pointing to a Correction when the Dubai debt crisis hit.

For more on related subjects, readers are encouraged to check out:

[source: StockCharts]

Disclosure: none

Tuesday, March 20, 2007

A First Look at the ISEE

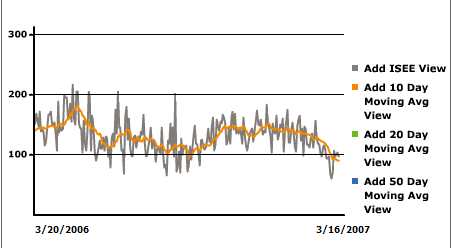
I briefly touched upon the ISEE yesterday; and while the ISE web site has a nice little graph of the ISEE going back a year, it is probably not sufficient to answer even the more casual questions about the usefulness of the index. Fortunately, the ISE has data going back to October 2002 available to download so that you can conduct your own analysis…or you can just keep reading.

For now I’m going to skip over the details of the debate about the usefulness of put to call ratios to help call market turns. If you want to do some research on this indicator, a good place to start would be Bill Rempel’s “The Significance of the Equity Put to Call Ratio” commentary at MarketThoughts.com.

Suffice it to say that I believe that it is worth the effort to watch this contrarian sentiment indicator and suggest that a good place to do so is the SchaeffersResearch.com page that graphs the CBOE equity (non-index) put to call ratio. You can create your own CBOE put to call charts at Stockcharts.com using $CPCE as the equity put to call ticker, $CPCI for the index put to call ticker, and $CPC for the total equity + index data.

The ISEE is actually a call to put ratio based entirely on purchases of calls and puts in which a customer is opening a position through the ISE itself. For more details and a testimonial of sorts I recommend a Wall Street Journal article by Mohammed Hadi.

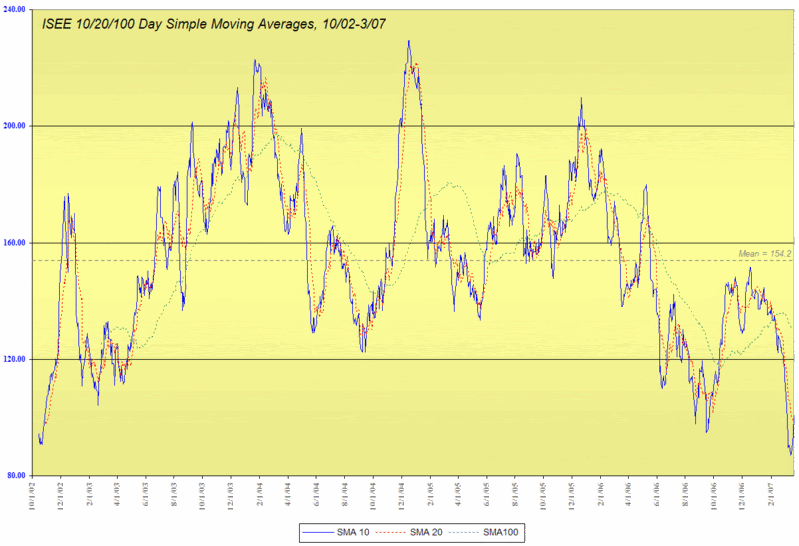
What do the ISEE data look like? I have graphed the 10, 20 and 100 day SMAs going back to 2002. They show a mean of 154, with obvious extreme readings falling conveniently at round numbers: below 100 and above 200. As a contrarian indicator, a reading of 100 or below is a good cutoff for overly bearish sentiment and a high likelihood of a bullish move ahead; 200 signals extreme bullishness and an increased chance of a bearish turn in the markets in the near future. In many respects, a high ISEE number is a lot like a low VIX number and vice-versa.

Turning to the ISEE as a predictor of future market performance, this is a subject that I will come back to regularly in this space, but for now I have posted a graph of the SPX and the 10 day SMA of the ISEE for the period 10/1/02 to 3/19/07. Note that the four largest spikes in the ISEE all preceded significant moves down in the SPX; also, low ISEE readings frequently marked the beginning of bullish moves.

Before wrapping up this subject for today, I will leave the reader with one last thought: the lowest 10 day SMA ever recorded for the ISEE was an 87.00 last Thursday.

DISCLAIMER: "VIX®" is a trademark of Chicago Board Options Exchange, Incorporated. Chicago Board Options Exchange, Incorporated is not affiliated with this website or this website's owner's or operators. CBOE assumes no responsibility for the accuracy or completeness or any other aspect of any content posted on this website by its operator or any third party. All content on this site is provided for informational and entertainment purposes only and is not intended as advice to buy or sell any securities. Stocks are difficult to trade; options are even harder. When it comes to VIX derivatives, don't fall into the trap of thinking that just because you can ride a horse, you can ride an alligator. Please do your own homework and accept full responsibility for any investment decisions you make. No content on this site can be used for commercial purposes without the prior written permission of the author. Copyright © 2007-2023 Bill Luby. All rights reserved.
 
Web Analytics