VIX Spikes Above Bollinger Bands
Yesterday’s 12% jump in the VIX lifted the volatility index to 13.8% above its 10 day simple moving average. As noted on a number of occasions here, when the VIX is at least 10% above its 10 day SMA, this is usually a good time to initiate a short-term mean reversion play and go long the SPX and/or short the VIX.
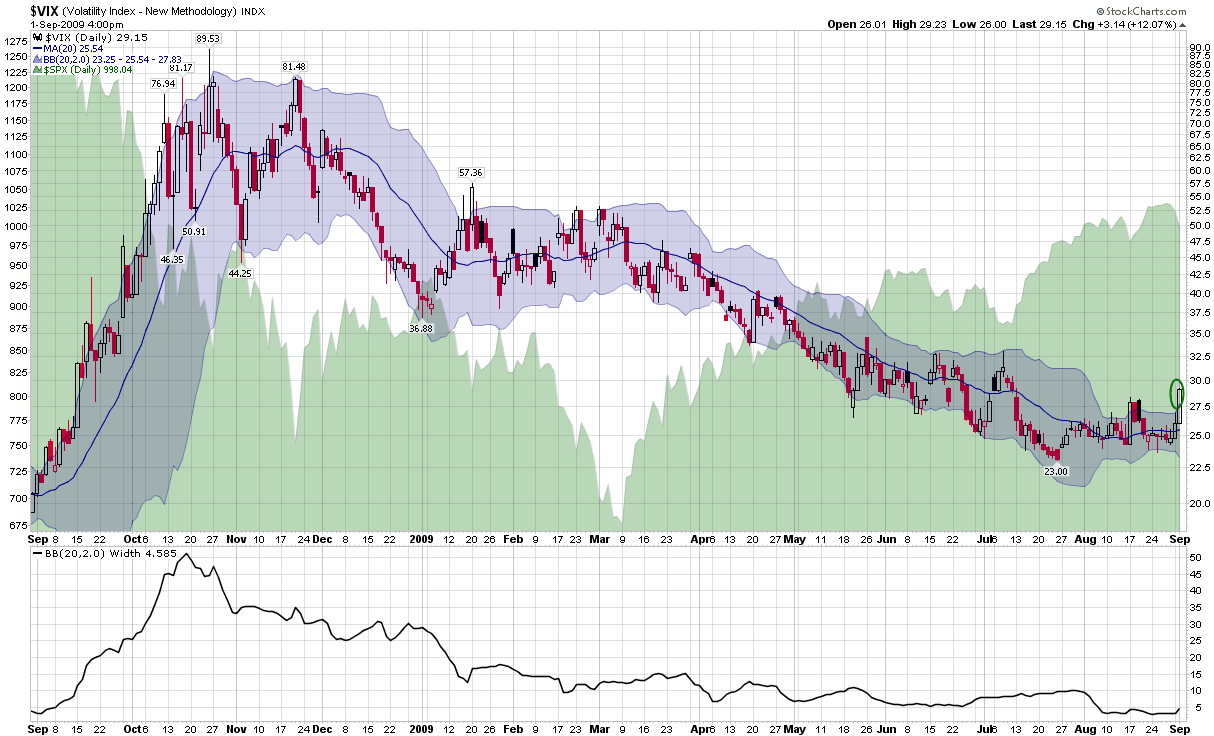
While I have not discussed it as often in this space, another useful VIX mean reversion signal can be derived from using Bollinger bands to determine when the VIX is overextended and likely to snap back. The simplest approach is to monitor when the VIX closes above the upper band of a 20 day, 2 standard deviation lookback period.
The chart below uses the standard 20 day, 2 standard deviation Bollinger bands to evaluate the moves in the VIX during the past year. Note that following the largest sustained VIX spike ever – during September and October of last year – it has been relatively rare for the VIX to close above the upper band. There was one instance of a close well above the upper band in January that marked a short-term bullish move, then there were two closes above the upper band at the end of February and the beginning of March that preceded the market bottom and strong bounce.
By historical standards, yesterday’s close 4.7% above the upper band is a fairly substantial breach and suggests a short-term bullish bias. Given the narrowing Bollinger band width (bottom study), however, it obviously took a much smaller move to penetrate the upper band than it did in January, when the VIX was hovering around 50.
It seems as if lately everyone has been looking for a pullback. The big question is how much of a pullback it will take to satisfy the bears and how soon it will be until the buy-on-the-dip mentality begins to dominate again.
For some related posts, try:
- The VIX and Bollinger Bands
- More Questions About Bollinger Bands
- Bollinger Bands: Why 20 Days?
- Bollinger Bands and the Standard Deviation Setting
- Charting the VIX with 10 Day SMA Envelopes
[graphic: StockCharts.com]


8 comments:
interesting post. i have found in some of my research that when b bands get skinny and the price (or vix in this case) breaks out above the top band in a meaningful way, that signal can be more indicative of sustained breakout as opposed to pending reversal in the opposite direction. wondering if the VIX has different properties than a typical stock price. need to test that.
Good point, JRD. Generally when you see a significant volatility breakout, you get an expanded volatility range -- at least for awhile. This is fairly common for stocks, but for the volatility of volatility (which would be the BB width for the VIX), this might not be as clear cut.
I'd be interested to hear what you come up with.
Cheers,
-Bill
Just a quick note to point out that my sometimes alter ego, Adam Warner (Daily Options Report), seems to be channeling some similar ideas this morning. His Mega VIX Overview is an excellent read.
I was playing around w/the Chalkin money flow (CMF) indicator and got some interesting readings on the various equity indices. But the readings on the dollar are more telling.
(sorry if slightly off topic - but I consider the fund flow and idea of "money on the sidelines" to be equally important to traders).
http://debtsofanation.blogspot.com/2009/09/debts-of-spenders-chalkin-money-flow.html
It's interesting that you compare this spike more to the one in January (that turned bullish for stocks) than to the one last Sept where the VIX kept climbing the upper band.
In Bollinger's book he says that violations of the bands (upper or lower) are suggestive of more movement in the SAME direction--even though there seem to be many strategies built on mean reversion of a spike through either band.
The bands for the vix and the s&p are not that large right now. Going long for more than a couple days on the S&P could be dangerous? Especially with the macd hist quite under water.
The rule with the VIX is that it needs to break 30 (or maybe even 35 to be safe) for a sustained upward direction and a bear market. We still haven't done that so this is probably signaling a short term rally. My guess is that it could be completing a shoulder on the S&P. We will see.
Manoutoftime,
I think it is important to make a distinction between stocks and volatility measures like the VIX. When stocks break out of a price or volatility range, they are more likely to continue in the same direction than the VIX, which has a strong mean-reverting tendency.
For example, right now both the VIX and BRCM are in the mid to upper 20s. If both were to break out to 35, you would expect BRCM would be much more likely to hold on to and/or extend those gains than the VIX.
Something to think about, anyway.
Cheers,
-Bill
Post a Comment