Updating the Triple ETF Options Landscape
A month and a half ago, in Triple ETF Options Landscape, I published a table of all the optionable triple ETFs. Lately I have received several requests to update the data from that post and I am glad to be able to do so today.
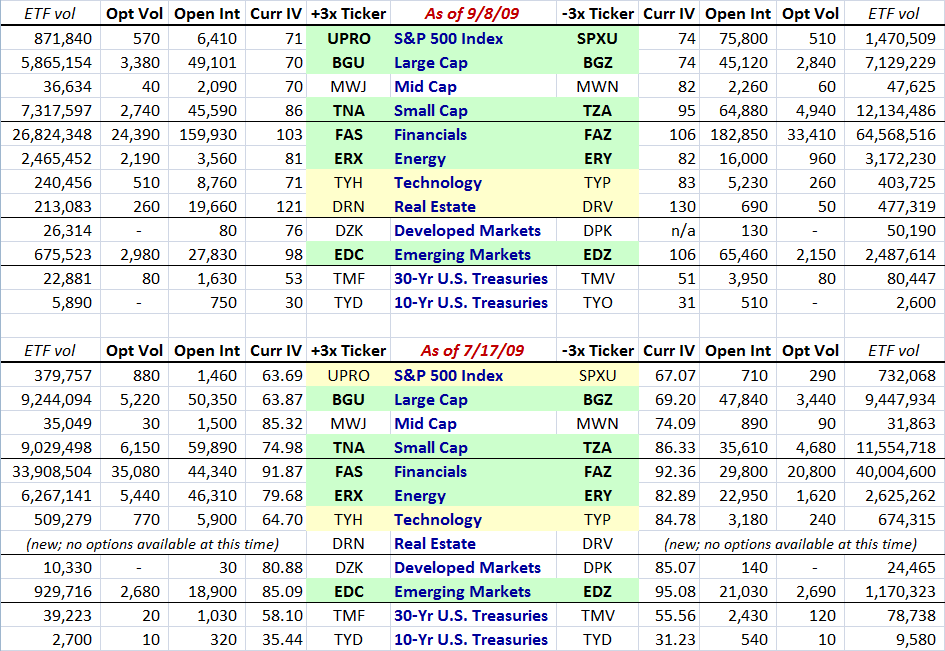
As was the case the last time around, I used data from iVolatility.com and separated the ETFs into four groups: broad index ETFs (market cap focus); sector ETFs; geography ETFs; and bond ETFs. I am also continuing my practice of color coding the ETF pairs in terms of liquidity tiers, with green being the most liquid, yellow the next most liquid, and white the least liquid.
At the time of the original post, I also included DRN and DRV, the Direxion 3x and -3x real estate ETFs, which had been launched just a couple of days earlier, on July 16th. This time around, there are two more entries in the triple ETF stable that have seen very light trading and do not yet have options associated with them. For these reasons, I have not included in the table below the MacroShares Major Metro Up (UMM) and MacroShares Major Metro Down (DMM) ETFs, both of which are linked to triple the percentage changes in the S&P/Case-Shiller Composite-10 Home Price Index.
In terms of investor interest and adoption, during the last month and half the biggest surge in interest has been in the UPRO and SPXU S&P 500 index pair, as well as the DRN and DRV real estate index pair. I have upgraded these pairs to the green and yellow liquidity levels, respectively. The emerging markets duo of EDC and EDZ also continues to gain traction, with options volume that is now on par with the most popular of the triple ETFs.
The chart below includes data through yesterday’s close and reprises the July 17th data for an easy comparison.
It should go without saying that these are extremely risky investment vehicles, with some peculiar characteristics. Anyone who need a good metaphor to understand just how risk triple ETFs is encouraged to check out Prediction: Triple ETFs Will Revolutionize Day Trading from November 14, 2008, when what now may seem obvious sounded then like the mutterings of a crazy man.
For related posts, readers are encouraged to check out:

[source: iVolatility]


3 comments:
That's rather studly. Can we by chance download that in MS Excel worksheet format to play with ourselves?...
So far I have stayed away from them.
For anyone who is interested in an Excel version of the graphic above, just drop me an email at bill.luby@gmail.com
Cheers,
-Bill
Post a Comment