Showing posts with label inverted VIX. Show all posts

Friday, January 18, 2013

The Inverted Percentile VIX

Of the many reasons that investors have a tendency to struggle with an interpretation of the VIX, one of the most obvious is an issue of orientation: for the most part, the VIX moves in the opposite direction of stocks. Frankly, it is difficult to appreciate some of the nuances of an upside-down world unless you spend a lot of time hanging upside down looking out at the world, like a bat.

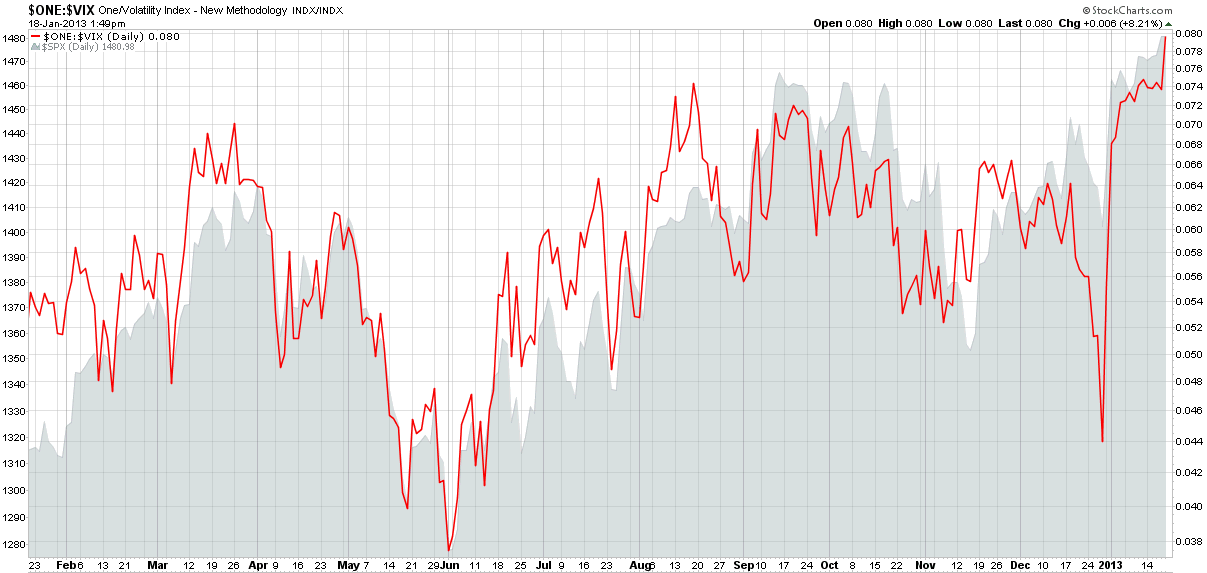
It is partly for this reason that I created the “inverted VIX” back in August 2007. At that time, the VIX had just spiked into the mid-20s only two months after having traded in the 12s. The chart below is an updated version of the inverted VIX over the course of the past year and demonstrates that for the most part, the SPX and the inverted VIX track fairly closely, though there are times, such as just prior to the fiscal cliff denouement, when the VIX sometimes strikes out on its own path.
[source(s): StockCharts.com]

Today we are seeing a VIX of about 12.50 – the lowest the index has been since June 2007 – and once again investors are grappling for the proper context. Let me throw a new concept into the mix that may help: the inverted percentile VIX, a distant cousin of the inverted VIX. The way to think about the inverted percentile VIX is in terms of the lifetime of VIX values, in which a VIX of 12.50 is in the 12.2 percentile. The inverse of that is the 87.8 percentile, which corresponds with a VIX of 28.67. Now I am guessing that for most investors a VIX of 12.50 feels much lower than a VIX of 28.67 feels high. Statistically they are almost identical in terms of being outliers, so if a 28.67 VIX doesn’t sound like a scary high number, then a VIX of 12.50 should not sound like a scary low number that is reflecting too much complacency.

Investors may wish to consider recalibrating their emotions and expectations or, failing that, take advantage of the relatively low VIX by buying some VIX calls so as to profit when the rest of the world comes to the realization that a VIX in the 12s is making them too nervous. Keep in mind, however, that current 10-day historical volatility of the SPX is in the 5s, so that number would have to double just to be able to support the current level of the VIX going forward.

Related posts:

Disclosure(s): none

Monday, May 19, 2008

Inverted VIX: The US Tour

I have mentioned the inverted VIX on two previous occasions, most recently about 5 ½ months ago in Inverted VIX Still Bullish.

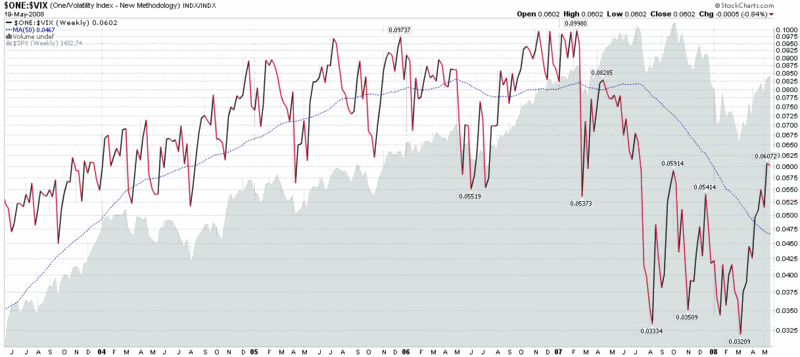
In the chart below, I continue my practice of displaying the inverted VIX in a weekly chart and looking at longer term patterns. A lot has changed on the volatility front in 5 ½ months, as evidenced by the fact that the current inverted VIX is farther above its 50 week moving average than it has been at any time since the record 64% one day spike in the VIX on February 27, 2007.

Perhaps even more interesting is that in this five year lookback period covered by the chart, current VIX levels look positively middling and unremarkable on an absolute basis, even though the VIX has come a long way in a short time on a relative basis. A new VIX floor in the 15-16 range is not unreasonable. It is higher than the new VIX floor of 13-15 I was calling for on August 1, 2007, but given all that has transpired in the markets over the past ten months, the fact that these numbers are even in the same ballpark is something to ponder.

[For more on why it is sometimes useful to turn charts upside down while analyzing them, readers may wish to check out A Different Way to Look at the VIX: 1999-2007.]

Wednesday, December 5, 2007

Inverted VIX Still Bullish

The inverted VIX was such a big hit in its debut that I thought I maybe we should cut one more album, then go on tour, perhaps somewhere that we can get paid in euros…

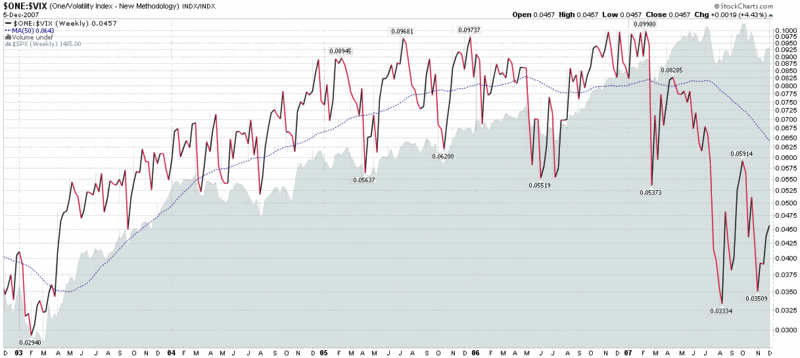
For those that haven’t bothered to click through one of the links above, the inverted VIX chart below is generated by calculating the inverse of the VIX (1/VIX in mathematical terms) so that it can be plotted in such a manner that VIX tops tend to coincide with market tops and VIX bottoms with market bottoms. For fun, I have added a 50 week SMA to the weekly chart of the inverted VIX, along with an area chart of the SPX.

The result, particularly when looking at the current value of the inverted VIX relative to the 50 week SMA, suggests a market that has just begun to rebound and still has a long way to go before it starts to get overbought.

To be fair, if this turns out to be the beginning of a bear market, neither the VIX nor the inverted VIX is likely to be a particularly helpful intermediate or long-term timing tool, as a graph of the inverse VIX during the 2000-2003 bear market demonstrates. Until we start making lower highs and lower lows in the broader indices, however, the VIX will continue to be a helpful tool for determining when to buy on the dips.

Thursday, August 9, 2007

A Different Way to Look at the VIX: 1999-2007

Sometimes just turning something upside down can help us to understand it. Anyone who has ever tried the techniques in Drawing on the Right Side of the Brain knows exactly what I am talking about.

The same applies to charts. If a stock looks like a buy on the charts, would you sell it if the chart were inverted? What if I were talking about an index?

Enter the VIX.

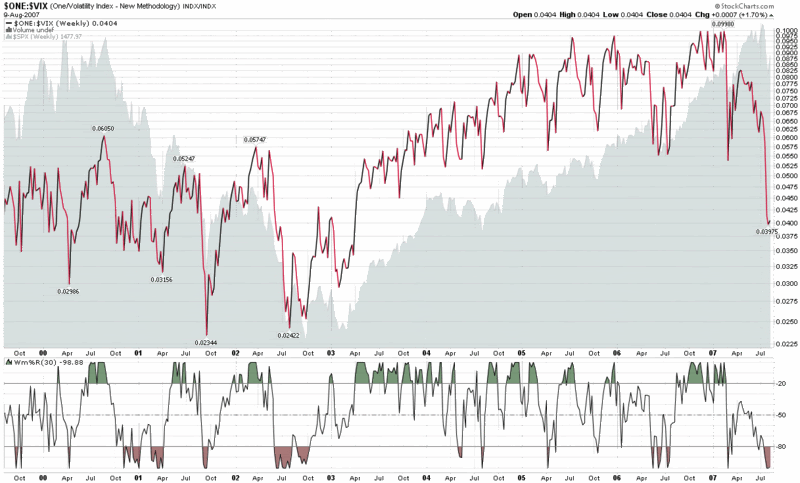
If you want to use the VIX to help determine when it is a good time to be long or short the markets, one of the best things to do is to invert it, as I have done in the graphic below. Here you can see that from 2003-2007 the buy on the dip strategy has worked well with both the SPX and the inverted VIX, with the bigger dips providing the bigger opportunities. This should come as no surprise, as in long bull markets any strategy that relies on buying the dips is almost guaranteed to be successful. The larger question is how to distinguish the dips from the extended bear markets.

To help think about this question, I have included the 1999-2003 data, which generally show the dips to be good buying opportunities in the 1-3 month time frame, but subject to the gravity of the bear pull over the longer term.

One other aspect of this chart bears mentioning: if you want to think of the VIX as a fear gauge, it is indicating that current fear levels are on par with that of 2001-2002.

Until further notice, I am still in the contrarian bull camp.

DISCLAIMER: "VIX®" is a trademark of Chicago Board Options Exchange, Incorporated. Chicago Board Options Exchange, Incorporated is not affiliated with this website or this website's owner's or operators. CBOE assumes no responsibility for the accuracy or completeness or any other aspect of any content posted on this website by its operator or any third party. All content on this site is provided for informational and entertainment purposes only and is not intended as advice to buy or sell any securities. Stocks are difficult to trade; options are even harder. When it comes to VIX derivatives, don't fall into the trap of thinking that just because you can ride a horse, you can ride an alligator. Please do your own homework and accept full responsibility for any investment decisions you make. No content on this site can be used for commercial purposes without the prior written permission of the author. Copyright © 2007-2023 Bill Luby. All rights reserved.
 
Web Analytics