Showing posts with label long-term volatility. Show all posts

Tuesday, May 13, 2008

Revert to What?

If there is one thing that most VIX-watchers can agree upon, it is that the VIX is ultimately a mean reverting animal. If you accept that postulate, then the next set of questions that spring to mind generally concern which mean the VIX reverts to and over what time period mean reversion takes place.

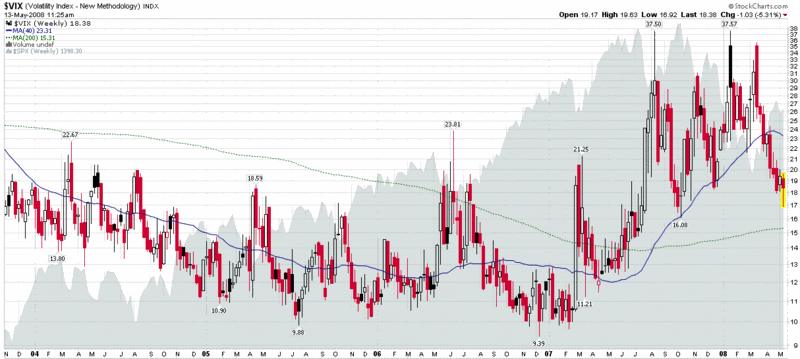
Since much of the discussion of the VIX centers around 10 day moving averages, I thought I would zoom out a bit, pull up a VIX weekly chart, and look at some long-term numbers: the 40 and 200 week simple moving averages.

Logically, one might assume that most of the activity in the VIX would fall neatly in between the 40 and 200 week SMAs. Interestingly enough, that has rarely been the case historically. During the past five years, for instance, the VIX has traded in the range between the 40 and 200 week SMA less than 20% of the time, as the VIX has trended down, then back up.

At current levels, the VIX is near the halfway point between the 40 and 200 week SMA, perhaps partly due to some of the gravitational effect of mean reversion. While current levels of volatility appear to resonate as too low for some, a continuation of the bullish bounce off of the March lows should send the VIX back to the 200 week SMA – or even lower.

In sum, while long-term VIX mean reversion does have some analytical use, it is less reliable than the short-term mean reversion patterns that are more commonly utilized for trading.
Monday, December 31, 2007

SPX Daily Volatility Below 80 Year Average in 2007

Kudos to Bespoke Investment Group for coming up with yet another interesting graphic, which I have reproduced below.

The graphic shows that the average daily volatility of the SPX was 0.72% in 2007, higher than the low volatility years of 2004-2006, but below the 80 year average of 0.75%.

For more information, try the original Volatility? What Volatility? post at Bespoke.

Tuesday, January 23, 2007

A Challenge to Two Things You Think You Know About the VIX

From Jason Goepfert via the virtual pen of Steve Sjuggerud and archives of Investment U and comes several VIX-related ideas that are worth mulling over 1 ½ years after they were published.

Goepfert, who heads up Sundial Capital Research and sentimenTrader.com, attempted to reconstruct what historical VIX data might have looked like if it were possible to simulate VIX readings all the way back to 1900. In this manner he developed what he calls a Faux-VIX that looks back over a century. As described by Sjuggerud, Goepfert determined that while current VIX readings look quite low by the historical standards that cover two decades of official CBOE VIX/VXO data, looking back to 1900 with the Faux-VIX, it appears that volatility readings below the current 11 level happen approximately one third of the time.

Further, and consistent with the initial post in this blog, Goepfert concluded that sustained periods of high volatility tend to alternate with lengthy periods of low volatility in cycles which average approximately five years. Much to my surprise, Goepfert then concludes that “buying the first large spike in volatility has paid off time and time again.” This contrasts sharply with my current thinking, which favors capitalizing on the mean-reverting tendencies of the VIX by fading large volatility spikes.

In future commentary, I will examine the degree and duration of various types of volatility spikes and return to Goepfert and the fade-or-buy-the-spike debate.

Note: For those who may be interested, Goepfert is a frequent contributor to Minyanville.com and archives of his articles on that site can be found here.

DISCLAIMER: "VIX®" is a trademark of Chicago Board Options Exchange, Incorporated. Chicago Board Options Exchange, Incorporated is not affiliated with this website or this website's owner's or operators. CBOE assumes no responsibility for the accuracy or completeness or any other aspect of any content posted on this website by its operator or any third party. All content on this site is provided for informational and entertainment purposes only and is not intended as advice to buy or sell any securities. Stocks are difficult to trade; options are even harder. When it comes to VIX derivatives, don't fall into the trap of thinking that just because you can ride a horse, you can ride an alligator. Please do your own homework and accept full responsibility for any investment decisions you make. No content on this site can be used for commercial purposes without the prior written permission of the author. Copyright © 2007-2023 Bill Luby. All rights reserved.
 
Web Analytics
