Revert to What?
If there is one thing that most VIX-watchers can agree upon, it is that the VIX is ultimately a mean reverting animal. If you accept that postulate, then the next set of questions that spring to mind generally concern which mean the VIX reverts to and over what time period mean reversion takes place.
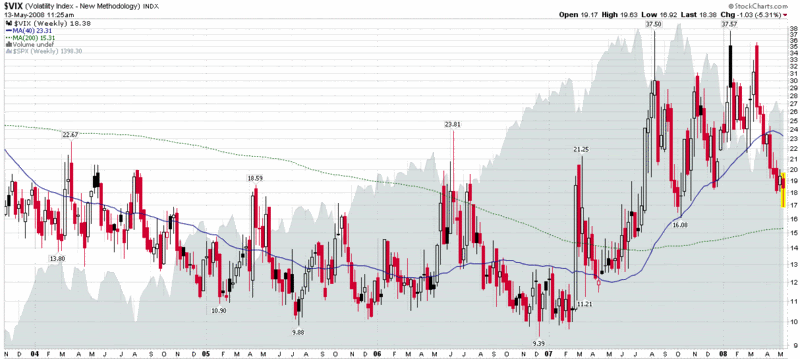
Since much of the discussion of the VIX centers around 10 day moving averages, I thought I would zoom out a bit, pull up a VIX weekly chart, and look at some long-term numbers: the 40 and 200 week simple moving averages.
Logically, one might assume that most of the activity in the VIX would fall neatly in between the 40 and 200 week SMAs. Interestingly enough, that has rarely been the case historically. During the past five years, for instance, the VIX has traded in the range between the 40 and 200 week SMA less than 20% of the time, as the VIX has trended down, then back up.
At current levels, the VIX is near the halfway point between the 40 and 200 week SMA, perhaps partly due to some of the gravitational effect of mean reversion. While current levels of volatility appear to resonate as too low for some, a continuation of the bullish bounce off of the March lows should send the VIX back to the 200 week SMA – or even lower.
In sum, while long-term VIX mean reversion does have some analytical use, it is less reliable than the short-term mean reversion patterns that are more commonly utilized for trading.


0 comments:
Post a Comment