Friday, January 14, 2011

Managing Risk with a Short VXX Position

Since I am not sure how many readers review the comments section, I thought I should pass along a recent reader Q&A in post format in order to capture the attention of a broader audience. By the way, if you would like to see more Q&A in this space or have a specific question you are longing for an answer to, just hit up the comments section below.

Reader Mike submits:

With less $$ going into the VXX EFT due to other options to shoppers, in theory VXX should continue dropping in price value as well, correct?
I lost a good amount of money longing VXX over the summer, but recouped all losses and made money towards the end of the year shorting VXX. Now, I've loaded up on shorting it with even more capital and have a very comfortable % gain so far this year. I want to protect that gain, but my belief is that VXX will continue much lower allowing for even more reward.
I'm thinking you have the same thoughts, is that right?

Hi Mike,

Good questions. VXX is more of a function of the price of the underlying VIX futures than the demand for the ETP, so unlike some neglected stocks, it will not drop just because demand slacks off.

I'm glad to hear you have done well shorting VXX. In terms of protecting your gains, you might want to consider buying some VXX calls to hedge your risk in the event of a VIX spike. Another thought is to convert your short VXX position into a long XIV position. While these positions look almost equivalent on the surface, when VIX spikes, the size of your VXX short will increase, while the size of your XIV long will decrease. This has implications for position concentration and potential margin issues, etc. It also means that instead of having losses compound if the VIX continues to rise, there will be a diminution of incremental losses.

For example, assume a net position of $100,000. If VXX jumps 10% three days in a row a short VXX position will lose $10,000, then $11,000, then $12,100. On the other hand a long XIV position would lose $10,000, then $9,000, then $8,100. In only a few days, the daily losses become 50% higher in short VXX than in long XIV. The longer the increase in volatility persists and the bigger the daily moves are, the larger the difference becomes. Recall that in April-May 2010, the VIX tripled in a month and VXX doubled. You might want to walk through how you can protect yourself should something like that happen again.

It's something to think about, anyway.

Good trading,

-Bill

Related posts:
Disclosure(s): short VXX and long XIV at time of writing

Thursday, January 13, 2011

Charting the Assets of the Volatility-Based ETPs

As a follow-up to yesterday’s Barron’s column, Ways to Turn Volatility into an Asset Class, I thought it might be interesting to track the history of assets for the volatility-based ETPs.

Not surprisingly, the assets have been dominated by the two ETPs that were first out of the gate:

  1. iPath S&P 500 VIX Short-Term Futures ETN (VXX)
  2. iPath S&P 500 VIX Mid-Term Futures ETN (VXZ)
The chart below, courtesy of ETFreplay.com, shows the history of the assets for the volatility-based ETPs. Note that through September 2010, VXX had been able to maintain a market share of about 70%. In the last few months, VXZ has been able to chip away at that lead, presumably due to investors’ tiring of contango and negative roll yield.

The impact of the recent crop of ETPs has yet to register on this chart, but I expect that in 2011, the share of both VXX and VXZ will drop dramatically as new entrants are responsible for most of the new money flowing into the space. In fact, I fully anticipate that buy the end of 2011, the $138 million currently in the “All Other” category will surpass that of VXX + VXZ. No matter how it plays out, one of the interesting stories of 2011 will be the degree to which investors embrace the most recent generation of volatility-based ETPs.

Related posts:

[source: ETFreplay.com]

Disclosure(s): long VXZ and short VXX at time of writing

Wednesday, January 12, 2011

Guest Columnist at The Striking Price for Barron’s

The last few times I have been asked to be a guest columnist for The Striking Price on behalf of Steven Sears at Barron’s, there has been a spike in volatility just about the time I go to commit my thoughts to paper keyboard + monitor. I had begun to think that the folks at Barron’s were somehow omniscient and knew when to put in a call to the bullpen for “that volatility guy.”

So when the call came again, I immediately had a Pavlovian urge to buy up some VIX calls, but alas the markets have been calm. Everyone seems to be wondering where the pullback is. If today’s column is not the catalyst, I’m not sure what it will take.

Speaking of which, I have elected to focus on volatility as an asset class for today’s guest column, which bears the title, Ways to Turn Volatility into an Asset Class. Part of my thesis is that 2011 is the year that volatility goes mainstream, largely due to the rise of volatility-based exchange-traded products, which are in the process of bringing volatility trading to the masses. I also repeat an earlier assertion that before the year is over, XVIX and XIV will gain significant traction as buy and hold volatility vehicles. For all the details, click through to read the original.

…and if we do see a major pullback soon, I expect the timetable to accelerate for investors to begin to embrace the stable of 15 volatility-based ETPs.

Related posts:

A full list of my Barron’s contributions:
Disclosure(s): long XIV and XVIX at time of writing

Monday, January 10, 2011

World Food Sub-Index Prices

Sometimes I just don’t know when to leave well enough alone, particularly when it involves that Holy Grailesque quest to cram every potentially relevant piece of data into one overcrowded chart.

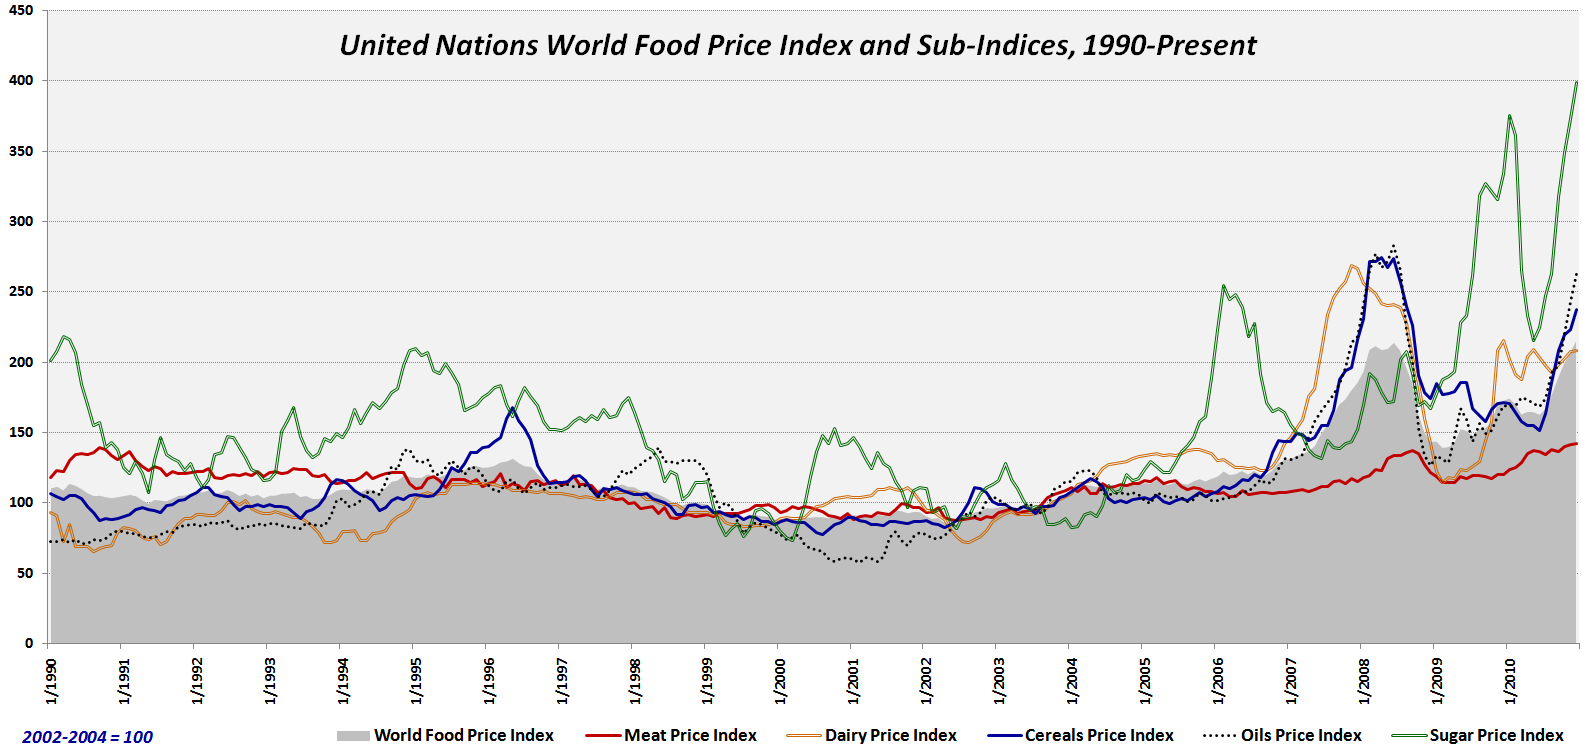
Yesterday’s Chart of the Week: World Food Prices is an example of a relatively uncluttered chart that attempts to make one or two simple points in a relatively clear and concise manner. After some back and forth with several readers, I have elected to butcher that simplicity and unveil a chart which adds the five sub-indices: meat; dairy; cereal; oils and sugar. The result, which I have appended below, shows that the real wild card in world food prices has been sugar, which is represented on the chart by the green line. To a lesser extent, cereal, dairy and oil have had their moments of extreme price fluctuations. By far the least volatile of the five sub-groups has been meat.

For those who are looking beyond futures to ETPs which can replicate some of these commodity sub-indices, there are a number of broad-based agricultural ETFs which cover most or all of the sub-indices. The popular PowerShares DB Agriculture Fund (DBA) is by far the most liquid of the group. Alternatives to DBA include RJA, JJA, FUD and UAG. For investors looking to target grains, JJG and GRU are worth investigating, as is the corn-specific ETP, CORN. For the sugar sub-index, SGG is an excellent match. JJS is an ETP for the ‘softs’ space and is almost equally weighted between coffee, cotton and sugar. Finally, both COW and UBC are potential proxies for the meat sub-index.

Related posts:


[source: United Nations]

Disclosure(s): long CORN and SGG at time of writing

Sunday, January 9, 2011

Chart of the Week: World Food Prices

Talk of rising commodities prices seems to focus primarily on energy and metals, with agricultural commodities often overlooked, at least in the United States.

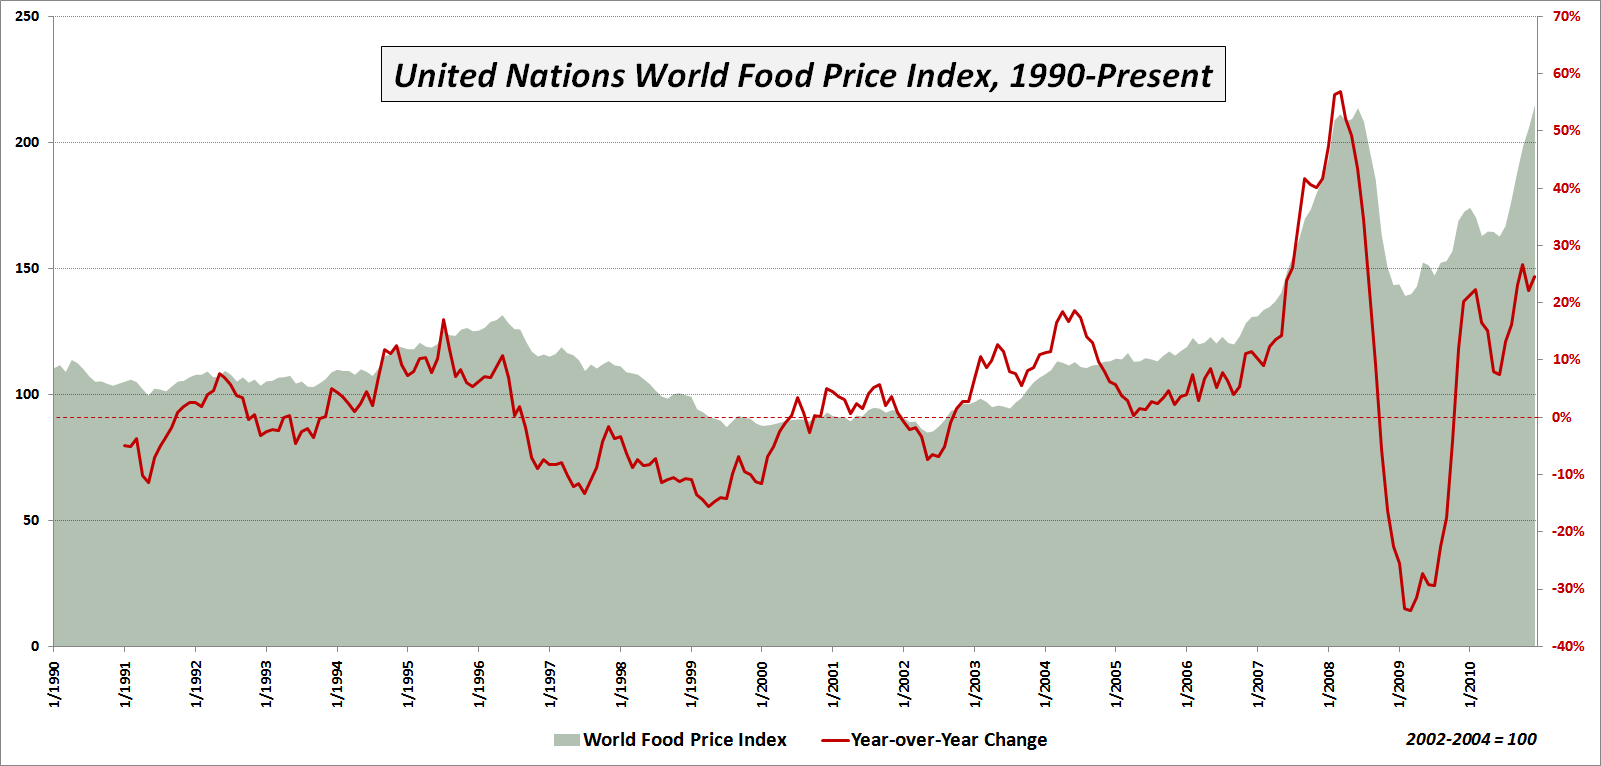
This week’s chart of the week is intended to underscore the inflationary trend in agricultural commodities and ‘softs’ (which generally refer to sugar, coffee and cocoa) as reflected in the United Nations World Food Price Index. As the chart below shows, world food prices hit a new high in December, after jumping more than 54% from a February 2009 low. The new high in the index eclipses the old high from June 2008.

Among the various sub-indices, the most dramatic increase has been seen in sugar, which is up 51% in just four months and is up a staggering 239% over the course of the past two years to a new all-time high. Meat prices are also at new highs, but while the sugar price index currently stands at 398.4, meat has only risen to 142.2. Note that all index values reflect a baseline of 100 that is derived from the 2002-2004 average prices.

Commodities prices have both economic and political implications. The economic implications are particularly severe for emerging markets in which food costs represent a disproportionately high percentage of the typical household budget. Here the incremental increase in food prices can have a disastrous impact on the family cost structure. There are also some countries where the possibility of food riots and related civil unrest has the potential to destabilize those who are in power and in some cases perhaps even thrust the political system into chaos.

So far rising food prices have triggered only a mild backlash here and there, but should prices continue to rise at the current rate of more than 20% per year, it is not possible to rule out catastrophic consequences across the globe.

Related posts:


[source: United Nations]

Disclosure(s):
none

Thursday, January 6, 2011

Shorting VXX and Long XXV or XIV

If you are interested in the VIX and related options and futures products, 2010 saw the arrival of an excellent new blog which is all over that space: Volatility Futures & Options.

The content is of such consistently high quality that I have made a mental note to feature some of it here from time to time and today seems like a good day to kick things off. The reason for my enthusiasm is a post from this morning called Case Solved: No Arbitrage, which follows a previous post on the subject: VXX-XXV Arbitrage?

I have probably received hundreds of questions and comments related to the advisability of shorting VXX and some of the obstacles in being able to execute such a strategy successfully. With the arrival of XXV, some investors thought that the inverse version of VXX might be a better way to accomplish the same goal. As it turns out, XXV has not performed as well as a short VXX position and Case Solved: No Arbitrage dives into the math and reverse engineers an excellent formula for calculating just how XXV performs relative to a short VXX position. I highly recommend clicking through to review the details.

Finally, I have noted on a number of occasions, including at some length in my subscriber newsletter, that the VelocityShares Daily Inverse VIX Short-Term ETN (XIV) is a better product for replicating a short VXX position than XXV. Investors have yet to arrive at the same conclusion as I have that 2011 will mark “the runaway success of VIX-based ETNs and ETFs, notably the recently launched XIV, which will prove that volatility vehicles can be good buy-and-hold investments,” but I am standing by my prediction and watching with interest to see how long it takes for money to start flowing into XIV.

Related posts:

Disclosure(s): short VXX and long XIV at time of writing

Wednesday, January 5, 2011

CBOE to Publish VIX-Style Volatility Indices for Individual Stocks

The volatility space continues to expand in the direction of the atomic level, with today’s announcement by the Chicago Board Options Exchange (CBOE) that it will begin disseminating implied volatility data utilizing the VIX calculation methodology for five stocks as of Friday, January 7th.

The five stocks are:

My initial thought include some of the following:
  • It will be interesting to see how much divergence there will be between the CBOE NASDAQ 100 Volatility Index (VXN) and the volatility indices for some of the key components of the NASDAQ-100 index, notably Apple, Google and Amazon
  • A Goldman Sachs volatility index will be particularly useful in terms of financial crisis
  • IBM is an interesting choice for a fifth wheel here, as IBM does not have the same bellwether status that it once did
  • Finally, first with weekly options and now with volatility indices for individual stocks, the CBOE has managed to shorten the scope of volatility analysis both at the issue level and in terms of the time frame. I’m calling this the march toward atomic volatility.
Related posts:
Disclosure(s): the CBOE is an advertiser on VIX and More

High Resolution Version of “The Year in VIX and Volatility” Chart Available

I had so many requests for a high resolution version of my chart from The Year in VIX and Volatility (2010) that I elected to make it available for download here. As an added bonus, a similar chart for 2009 is available here.

Related posts:

[source: StockCharts.com]

Disclosure(s): none

Tuesday, January 4, 2011

The Year in VIX and Volatility (2010)

One of everybody’s favorite charts from a year ago was the basis for Chart of the Week: The VIX and Volatility in 2009, in which I created a fairly concise annotated summary of the year in VIX and volatility.

For some reason, the same chart seemed harder to create for 2010, partly because the volatility triggers were less discrete and seemed to arrive in recurring waves, each time apparently posing a different size threat. The European sovereign debt crisis is a prime example of the waves of threats, as are the concerns about China’s ability to navigate the dual hazards of slowing growth and rising inflation. In the U.S., concerns about a double-dip recession waxed and waned, while investors scratched their heads wondering just how much to worry about the foreclosure crisis or events on the Korean peninsula.

On the volatility side, the highlights of 2010 included the ‘flash crash’ in May and an even bigger VIX spike (to 48.20) toward the end of the month as the European sovereign debt crisis threatened to snowball out of control, pushing the VIX to a higher close than at any point prior to the 2008 financial crisis.

Investors also struggled under the psychological weight of the Deepwater Horizon oil spill in the Gulf of Mexico, which imparted a sense of helplessness across the U.S. and helped to dampen any sort of optimism about the economy and perhaps even technological progress in general.

In spite of all this, stocks rallied impressively for the last four months of the year, due in part to a second round of quantitative easing on the part of the Fed.

The year saw record volumes in a number of VIX-related products and included new daily record volumes in VIX options (June 11), VIX futures (November 16) and the increasingly popular iPath S&P 500 VIX Short-Term Futures ETN, which most investors know by its ticker symbol, VXX (November 23).

Volatility made its mark as a peripheral asset class in 2010, with VIX-based ETNs, making it much easier for retail investors to make direct investments in volatility. My guess is that this development is just a beginning and 2011 could mark a watershed year in terms of recognizing of volatility as a mainstream asset class.

Related posts:


[source: StockCharts.com]

Disclosure(s): short VXX at time of writing

Monday, January 3, 2011

S&P 500 Index 20-Day Historical Volatility Hits 39-Year Low

Since I haven’t seen it mentioned anywhere else, I thought I should note that 20-day historically volatility in the S&P 500 index hit its lowest level since April 1971, the same month that the Rolling Stones released Sticky Fingers and Charles Manson was sentenced to death.

Now there are multiple ways to calculate historical volatility. I outlined my preferred non-centered methodology in Calculating Centered and Non-Centered Historical Volatility, which yielded a 20-day HV of just 4.57 as of Friday’s close, barely 25% of the VIX’s closing value of 17.75 from the same day.

Of course, some of this disconnect is due to the holiday effect or calendar reversion, but given that we are seeing near-record lows in some volatility measures just two years and a couple of weeks removed from a VIX of 80+ should certainly raise some eyebrows.

In terms of implications going forward, today’s big(ger) move should herald the return of more normal volatility, as well as more middling implied and historical volatility measures.

Related posts:

Disclosure(s): none

Chart of the Week: The Year in Economic Data (2010)

One of the blog’s surprise hits in 2010 was a series of charts I began which started out with the unwieldy title of Trends in Economic Data Relative to Expectations.

I have utilized this chart format to track the performance of key economic data releases relative to consensus expectations.

The data are sorted into five groups and include economic reports such as the ones highlighted below:

  • Manufacturing/GeneralGDP, ISM, Industrial Production, Capacity Utilization, Durable Goods, Factory Orders, Regional Fed Indices, Productivity, etc.
  • Housing/Construction – Building Permits, Housing Starts, Existing Home Sales, New Home Sales, Pending Home Sales, S&P/Case-Shiller Home Prices, Construction Spending, etc.
  • Employment Employment Report, Jobless Claims, etc.
  • ConsumerRetail Sales, Consumer Confidence, Consumer Sentiment, Personal Income, Personal Spending, etc.
  • Prices/Inflation – Producer Price Index, Consumer Price Index, etc.
For each report, I evaluate whether the data exceeds or falls short of consensus expectations. I then aggregate the data over time to see the extent to which certain segments of the economy are trending higher or lower relative to expectations.

The chart tells a couple of interesting stories for 2010. First, it was the manufacturing sector which provided the bulk of the positive surprises during the first half of the year and the propelled stocks to their April highs.

Manufacturing began to turn down in May, following stocks down. This was just about the time that housing and construction started to provide some evidence of positive surprises, but that sector did nothing to stem the tide of falling stock prices.

When stocks started to turn around at the end of August and make their big bullish move for the year, this coincided with an improving employment picture, a rebound in manufacturing and an upturn in the consumer.
Over the course of the year, economic data came very close to meeting expectations for all sectors except housing and construction, which was the surprise winner in the data vs. expectations sweepstakes.

Finally, as the year came to a close, it was employment which was most highly correlated with changes in stock prices, followed closely by a virtual dead heat between housing/construction and the consumer.

Related posts:

Disclosure(s): none

Friday, December 31, 2010

In 2010 I Learned That…

Josh Brown of The Reformed Broker has an excellent post up today, In 2010 I Learned That…, in which he aggregates a wide variety of market perspectives from his broad network. The results have a large dollop of market wisdom, yet are spiced with the type of humor and satire that is a hallmark of Josh’s efforts.

When asked for some input about what I learned in 2010, my immediate reaction what that I hadn't learned as much in 2010 as I had in 2009 and 2008. After a moment of reflection, five ideas tumbled out of my head, in the following order:

  1. Substantial profits can be made from surfing the bleeding edge of Wall Street's product development engine (this is the one Josh chose to include in his post)
  2. The more confident you are in the value of your primary strategies, the more difficult it is (should be) to pull the trigger on other strategies/trades with less impressive or uncertain prospects
  3. There is a huge desire for investors to understand the VIX futures term structure and its implications
  4. When you combine ETFs and options, almost any possible trade idea can be implemented
  5. A good portfolio is one that funds a good vacation without the need for frequent monitoring of positions (my wife’s favorite of this group)
[As an aside, while Josh has a penchant for nailing the humorous side of the investment world, his On a Personal Note… from yesterday shows his talent for writing about the poignant as well.]

Readers, what have you learned in 2010? Feel free to hit up the comments…

Related posts:
Disclosure(s): none

Thursday, December 30, 2010

Top Posts of 2010

It is hard to believe that I have been blogging for four years. Initially I just thought I’d take a couple of minutes during the slow period of the trading day to capture a thought or two for archival purposes, but that original intent has continued to morph into something far beyond what I imagined.

These days most of what I post is for the benefit of readers rather than to aid my personal recollection, but I like to keep things eclectic, provocative and visually interesting for the benefit of all.

The end of the year is a great time to reflect on what readers have found to be of interest at VIX and More. Each year new themes seem to emerge among the top 25 most read posts in this space. This year the dominant themes seem to incorporate the VIX-based ETNs (specifically VXX), contango, the VIX futures term structure and put to call ratios. The #1 post of the year, The Education of a Trader, is one of the few times I have talked about my own trading, but I imagine it is the universality of the message that struck a chord with most readers.

[I hope it goes without saying that clicking on any of the hyperlinks above will pop up a list of all posts I have tagged with that label.]

Thanks to all who have contributed in one way or another to the content here. I like to say that not every day shows a profit, but every day should make you smarter, which will help the bottom line in the days and weeks ahead.

  1. The Education of a Trader
  2. Chart of the Week: VXX vs. VIX
  3. Chart of the Week: CBOE Equity Put to Call Ratio Nears All-Time Low
  4. Rule of 16 and VIX of 40
  5. VIX Futures Contango Soars
  6. Chart of the Week: VXX Celebrates One Year of Futility
  7. Short-Term and Long-Term Implications of the 30% VIX Spike
  8. VIX Futures Contango Bubble
  9. Largest Pullback Since March 2009 Rally Began
  10. Chart of the Week: Total Put to Call Ratio
  11. Yesterday’s Unusually Low ISEE Equity Call to Put Ratio
  12. VXX 1-4 Reverse Split Reminder, After Today’s Close
  13. Chart of the Week: Ten-Year Treasury Note Yield
  14. Charting the Selloff with an Andrews Pitchfork
  15. Direxion and S&P Bring Dynamic Volatility Hedging to ETFs with VEQTOR
  16. VIX Approaches Pre-2008 Record Highs
  17. SPX Pullback Now Second Largest Since March 2009
  18. XXV and the New VIX ETN Landscape
  19. Some Favorite ETF Sites
  20. SPX Historical Volatility at Two Year Low
  21. Chart of the Week: The Flight-to-Safety Trade
  22. Mamis Overbought-Oversold Indicator
  23. VIX Futures: What Were/Are They Thinking?
  24. Bears Emboldened By Low CBOE Equity Put to Call Ratio
  25. Technical Resistance Looms in the S&P 500 Index
For more on related subjects, readers are encouraged to visit the posts tagged with the label archival or check out:
Finally, I have tagged a select group of posts (including six from 2010) as worthy of a somewhat arbitrary “hall of fame” designation. These are all posts in which, regardless of popularity, I believe the content reflects some of the best efforts on this site.

Disclosure(s): short VXX at time of writing

Wednesday, December 29, 2010

VIX Futures Brokers

In light of my comments about MB Trading yesterday, a reader was quick to point out that MB Trading does not offer VIX futures.

For those who may be interested, the CBOE Futures Exchange (CFE) maintains a current list of VIX futures brokers which I have reproduced below:

Futures Commission Merchants (FCMs)

Introducing Brokers (IBs)

Clearing Firms

  • Advantage Futures
  • Bank of America
  • Barclays Capital Inc.
  • BNP Paribas
  • Citigroup Global Markets Inc.
  • Credit Suisse
  • Deutsche Bank
  • Electronic Brokerage Systems LLC
  • Fimat
  • Fortis Clearing LLC
  • Goldman Sachs Global Clearing & Execution
  • Interactive Brokers
  • J.P. Morgan Futures Ltd.
  • Man Financial
  • Merrill Lynch Pierce Fenner & Smith
  • Morgan Stanley & Co. Ltd.
  • Newedge USA LLC
  • Nomura Securities
  • O'Connor & Co. LLC
  • Pax Clearing
  • Prudential Bache Commodities, LLC
  • RBC Capital Markets
  • Timber Hill
  • Tradelink
  • UBS Securities Ltd.
  • Vision Financial Markets

For those who have been drawn into the world of VIX futures as a result of the growth of VIX-based ETNs, perhaps 2011 will be the year to trade VIX futures directly, rather than through various exchange-traded products.

Related posts:

[source: CBOE Futures Exchange (CFE)]

Disclosure(s): the CBOE is an advertiser on VIX and More

Tuesday, December 28, 2010

MB Trading Actively Screening New Customers?

I do my best to maintain accounts with a wide variety of brokers, particularly with those who are partial to options traders, in an effort to get a sense of how various tools and platforms are evolving at the broker level, keep up to date on educational offerings, etc.

In the last year or two, I have opened new accounts at tradeMONSTER and OptionsHouse and have had very positive experiences with both brokers. One broker that I have been meaning to try for awhile is MB Trading, which has been a top performer in the Barron’s online broker rankings (with additional details here) for the past few years.

Much to my surprise, when I heard back from MB Trading today it was to request more details related to my employment and the like. Keeping in mind that any broker new account application for options and futures trading has a comprehensive list of questions related to employment, assets, trading experience, etc., but for the first time out of perhaps 15-20 new account applications I discovered a broker that was intent on conducting additional due diligence over and above what is covered by the standard application. I have to assume this development is specific to MB Trading and I applaud this effort. It is always nice to know that a place where I put my money uses some discretion in the money they accept from others.
 
[Note that Theresa Carey, who authored the Barron’s online broker rankings, also maintains an excellent blog, Investor Brain, where she discusses the latest developments in the online broker space, in terms of functionality and features, as well as industry-level issues.]

Related posts:

Disclosure(s): none

DISCLAIMER: "VIX®" is a trademark of Chicago Board Options Exchange, Incorporated. Chicago Board Options Exchange, Incorporated is not affiliated with this website or this website's owner's or operators. CBOE assumes no responsibility for the accuracy or completeness or any other aspect of any content posted on this website by its operator or any third party. All content on this site is provided for informational and entertainment purposes only and is not intended as advice to buy or sell any securities. Stocks are difficult to trade; options are even harder. When it comes to VIX derivatives, don't fall into the trap of thinking that just because you can ride a horse, you can ride an alligator. Please do your own homework and accept full responsibility for any investment decisions you make. No content on this site can be used for commercial purposes without the prior written permission of the author. Copyright © 2007-2023 Bill Luby. All rights reserved.
 
Web Analytics