Thursday, February 28, 2013

The Options and Volatility ETPs Landscape

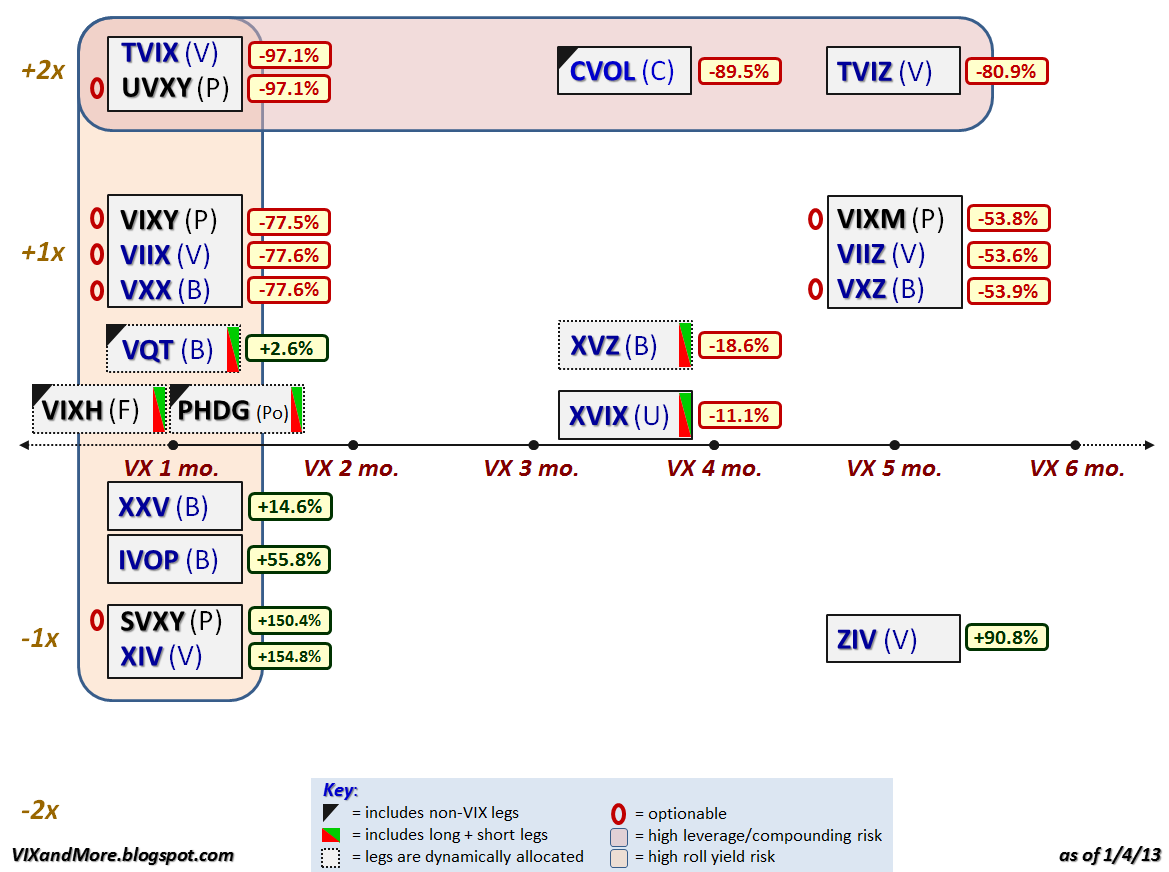
For several years I have publishing a graphical overview of the VIX ETPs landscape, with all the ETPs plotted on the basis of leverage and target maturity, such as the recent VIX ETP Returns for 2012.

Lately, however, an expanding crop of options and volatility ETPs has been taking root in a space that is closer to the VIX products than any of the other ETPs. I talked about the low volatility ETPs at some length in yesterday’s Beyond SPLV: The Expanding Universe of Low Volatility ETPs.

The graphic below is a plot of these securities, with the their geography, market cap and asset class in the rows and strategy/approach in the columns. I have talked about PBP in this space and was particularly interested to see that the buy-write / covered call approach is now being applied to gold in the form of the recent launch of GLDI.

Part of what prompted today’s approach is the launch of U.S. Equity High Volatility Put Write Index ETF (HVPW), which is the first put-write ETP on the market. I have talked about put-write strategies and the CBOE S&P 500 PutWrite Index (PUT) at some length here in the past and have included some links below for additional reading.

In the convertible bond space, CWB has been the most popular ETP in this space for the last few years. Earlier this week, PowerShares closed its competing Convertible Securities Portfolio ETF (CVRT), essentially ceding this space to CWB for now.

The other portion of the graphic below is my attempt at translating much of yesterday’s text into a format that makes for a more handy reference.

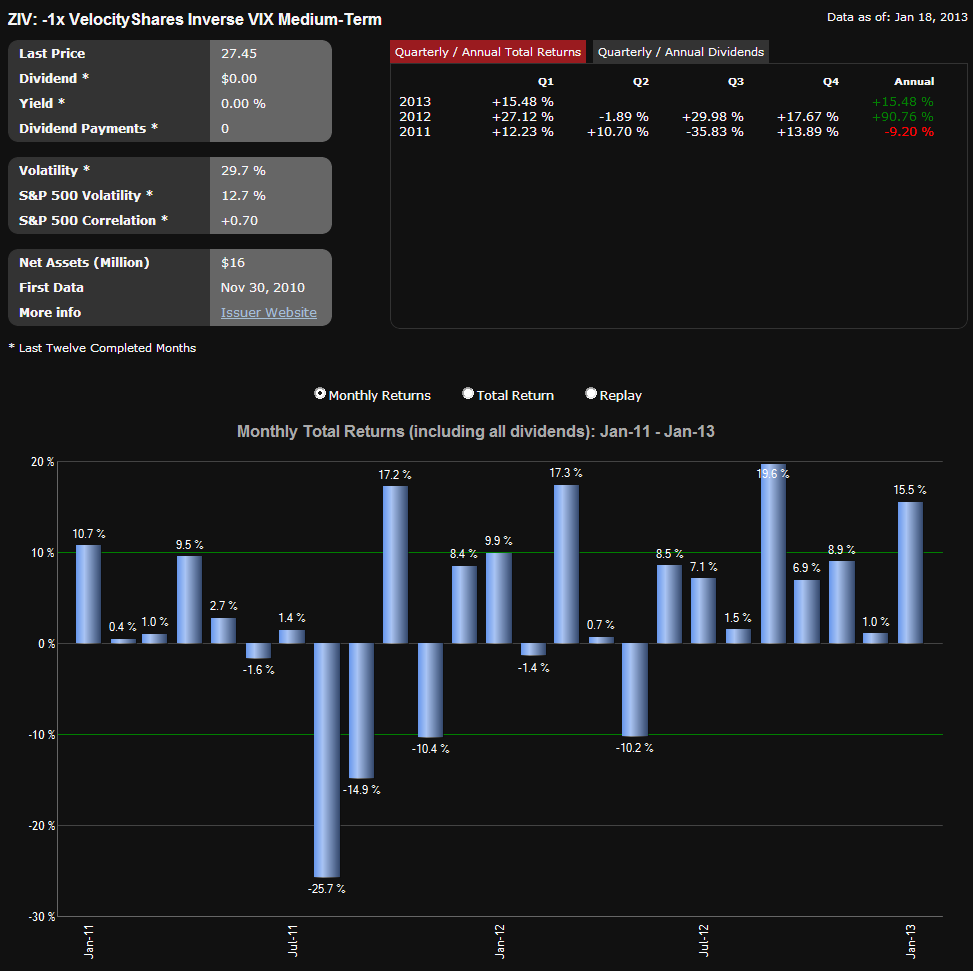
I will keep tabs on all of these ETPs going forward and in particularly look to see how HVPW and GLDI do in terms of both risk-adjusted performance and investor acceptance. I certainly hope it does not take investors as long to discover these products as it did for them to warm up to the likes of ZIV.


Related posts:

Disclosure(s): long PBP at time of writing

Wednesday, February 27, 2013

Beyond SPLV: The Expanding Universe of Low Volatility ETPs

The spike in volatility that hit a climax on Monday has apparently passed with the swiftness of a summer thunderstorm. Of course, as I explained more than six years ago in What My Dog Can Tell Us About Volatility, things are never really quite the same after the storm passes, which is why we often encounter a phenomenon I call echo volatility.

Most investors – and I know I am the exception here – do not like volatility and actively seek out strategies that minimize the volatility of their portfolios. This low volatility approach has a great deal of merit and a fair amount of academic studies to support the rationale behind low volatility investing. For those who might not be interested in wading through the academic literature, the chart below shows how SPLV has significantly outperformed SPY since its launch, with substantially less volatility along the way.

Since the exchange-traded revolution began, investors have been blessed with a variety of low volatility sector ETPs, such as utilities (XLU) and consumer staples (XLP) as well as a strong selection of value-oriented ETPs (e.g., IWD and VTV) and dividend-focused ETPs (e.g., VIG, DVY and SDY), but it was not until May 2011 that there was an exchange-traded product that specifically target low volatility holdings. Enter the PowerShares S&P 500 Low Volatility Portfolio ETN (SPLV), which immediately began attracting a following and now has $3.4 billion of assets. SPLV had the benefit of being first to market, but its success has prompted the launch of many similar products, of which the most successful has probably been the iShares MSCI USA Minimum Volatility ETF (USMV). Since then, PowerShares and iShares have expanded their product line of low volatility ETPs to cover international stocks (EFAV,ACWV, IDLV) and emerging markets (EEMV, EELV).

The newest battleground in the low volatility race is a U.S. market cap focus, with the launch by PowerShares of the PowerShares S&P Mid Cap Low Volatility Portfolio (XMLV) ETN and the PowerShares S&P Small Cap Low Volatility Portfolio (XSLV) ETN earlier this month. I mention these two new entrants because the distinction between these two and SPLV is much more than the market cap. Indeed, the differences in sector weighting are at least as substantial as the differences in market cap. Starting with SPLV as a benchmark, here the current sector weightings are 31% utilities, 24% consumer staples and 15% financials. In contrast, XMLV is weighted with 51% financials, 24% utilities and no other sector representing more than 8% of the portfolio. Not too dissimilar is XSLV, which is weighted 50% in financials and 16% in utilities. The bottom line is that these two new products are not just smaller cap versions of SPLV, but portfolios with a strong financial component, very little exposure to consumer staples and more exposure to sectors such as information technology and industrials, so the redundancy between SPLV and either XMLV or XSLV is smaller than one might expect.

Aggressive and conservative investors alike should make an effort to have a portion of their portfolio dedicated to lower volatility instruments. While more traditional sector, value and dividend approaches still make some sense, the expanding menu of targeted low volatility products certainly deserve a long look as well – preferably before the next big volatility storm.


[source(s): ETFreplay.com]

Related posts:
Disclosure(s): none

Tuesday, February 26, 2013

Record VIX Options Volume and Large Purchases of VIX Calls

With about a half hour left in today’s trading session, purchases of VIX options are unusually high – much higher than yesterday. As I type this, over 855,000 VIX calls have been traded, with today likely to see the highest VIX call volume since the August 2011 market panic. Data from LivevolPro indicate that 28% of VIX call transactions are being bought on the ask, versus 16% sold at the bid, reflecting a lack of price sensitivity on the part of the buyers of VIX calls, who are the driving force behind these transactions. All told, a record 1.3 million VIX options contracts have been traded, breaking the old record of 1.22 million from September 11, 2012.

Note also that while the VIX’s implied volatility has been on the rise as of late, at its current level it is in the middle of its 2012 range.

The equities market may feel more orderly and composed today, but in the options market, there are signs of increasing anxiety and concern.

[source(s): LivevolPro.com]

Related posts:

Disclosure(s): neutral position in VIX via options; Livevol is an advertiser on VIX and More

Updated SPX Pullback Summary Table for SPX 1485

One of the graphics that I receive many request for and is my SPX pullback summary table. This table starts with the bottom in the SPX in March 2009 and tracks all meaningful peak-to-trough pullbacks from various new highs in the SPX.

Last week’s new high of SPX 1530.94 and this week’s selling have given me an excuse to update that table with current data – and I have taken the liberty of assuming that the SPX low of 1485.01 from earlier today holds up for now. Using this data, of the 19 pullbacks in the table below, the mean duration is 19 days and the mean pullback is 7.3%. For comparison sake, the medians are considerably lower at 7 days and a 5.6% drawdown.

Extrapolating from these averages, a mean pullback would bring the SPX back to 1420, while a median pullback would suggest a downside target of 1446. Of course these are just averages; a repeat of the 21.6% pullback from 2011 would put the SPX back exactly at 1200.

[source(s): Yahoo, VIX and More]

Related posts:

Disclosure(s): none

Monday, February 25, 2013

Best VIX Conference of the Year? Try the CBOE RMC

Since everyone wants to talk about the VIX right now and I often get asked what the best conference is for the VIX and volatility aficionado, I should note that my favorite VIX conference, the 29th Annual CBOE Risk Management Conference (RMC), begins this Sunday and runs through Tuesday. The conference is being held in Carlsbad, California (about 30 miles north of the San Diego airport) at the Park Hyatt Aviara Resort.

The CBOE offers the following description of the RMC:

“The RMC is an educational forum where end users of equity derivatives discuss new policies, strategies and tactics to manage risk exposure and enhance yields. The conference provides an ideal setting for institutional users and prospective users of exchange-traded derivatives to network with their peers, exchange ideas and learn the latest information about new products and risk management strategies.

Whether you're interested in learning the latest risk management techniques or simply mastering the fundamentals, the Risk Management Conference™ is a valuable opportunity to learn from some of the top traders and strategists.

With topics ranging from basic derivatives applications to advanced trading concepts, the RMC is a must for financial professionals who need to stay current with industry trends and learn how to effectively use the latest risk management tools and strategies. Now more than ever, the CBOE Risk Management Conference is a conference you must attend.

RMC sessions are led by top industry practitioners and researchers - no sales pitches - and it is the only conference of its kind featuring a comprehensive options and futures educational series.”

For more information, you can check out the CBOE RMC agenda and register from any page on the site.

While I was unable to attend last year’s conference, I was impressed by the 2011 event and have the RMC as my only ‘must go’ conference for each of the coming years. On second thought, the CBOE did sponsor the CBOE RMC – Europe in County Wicklow, Ireland last September and if the European version of this conference comes around again this year, I might have to rethink my priorities.

I will be the Carlsbad conference at the end of this week. If you would like to say hello, just look me up or drop me note.

Related posts:

Disclosure(s): the CBOE is an advertiser on VIX and More; VIX and More is a sponsor of the CBOE Risk Management Conference

All-Time VIX Spike #11 (and a treasure trove of VIX spike data)

Today was one of those days that caught a lot of people off guard. Halfway through today’s trading session stocks we largely unchanged, then some pockets selling began when results of the elections in Italy started trickling in, suggesting the possibility of a deadlock in the Italian parliament and perhaps the need for another round of elections.

The governmental chaos is largely the result of rise of two intriguing political figures. One of these is the phoenix known as Silvio Berlusconi and his People of Freedom (PDL) party, which is anti-austerity and has proposed a policy of massive tax cuts and talked about the possibility of leaving the euro. The bigger electoral surprise is Beppe Grillo and the Five Star Movement (M5S), where Grillo’s populist agenda and anti-corruption message have resonated with voters. Both Berlusconi and Grillo have had a much stronger influence on the elections than most had anticipated and with Italy’s relationship with the euro zone now in question, the euro fell to under 1.31 against the dollar for the first time in six weeks.

U.S. stocks, which had seemed impervious to the sequestration threat, began selling off sharply as a result of the confusion about the future of the Italian government, with selling gathering steam during the second half of today’s session and accelerating sharply during the last hour, when the S&P 500 index fell more than 1% and the VIX spiked 14.4%.

For the full day, the SPX was down 1.83% and the VIX was up 34.02%. The 34% spike in the VIX makes it the eleventh largest one-day spike in the 24 years of VIX historical data going back to 1990.

The first question on everyone’s mind is what the implications of the VIX spike are for stock prices and volatility going forward. The truth is that the historical record following a large one-day VIX spike is somewhat spotty. The table below captures some data from the top 20 one-day VIX spikes. Note that on average (here is where I like to remind everyone that it is possible to drown crossing a stream that is one inch deep ‘on average’) stocks generally outperformed following a big VIX spike for up to one week (SPX ROI +1 to +5 days) and also performed well looking out more than two months. From one week to two months, however, stocks have underperformed following a large VIX spike.

Note that the table below is based on a small data set and if one extracts subsets of this data for the VIX at certain absolute levels or during selected periods or even relative to the magnitude of the change in the SPX, it is possible to draw some very different conclusions. Part of the reason for this may be due to the sample size and part of the answer may be that a clear-cut interpretation of this data is not easy to extract. For these reasons, I have included a fair amount of relevant data and encourage readers to draw their own conclusions.

[source(s): CBOE, Yahoo, VIX and More]

For those who are interested in more conclusive research and analysis on VIX spikes, volatility and other subjects related to today’s events, the links below are an excellent place to start.

Related posts:

Disclosure(s): short VIX at time of writing

Wednesday, January 30, 2013

VXX and VXZ Celebrate Fourth Birthday

What better way to celebrate your birthday than by ripping off a huge gain. That’s what VXX must have been thinking today as it gained 6.2%, while it’s often overlooked sibling, VXZ, gained 2.2%.

Of course, the last four years have not been kind to these VIX exchange-traded products in the aggregate, but for selected periods, they have been remarkable performers. Just ask anyone who was short VXX when it spiked 198% during a period from July to October of 2011.

In spite of that impressive short-term performance, both VXX and VXZ have lost ground in each of the four years since their launch. To be fair, though, so did the VIX, if one measures each ‘performance year’ from January 30th.

The table below shows the performance of VXX, VXZ, the VIX and SPY during each of those January 30th performance years. When one considers that in each of those yearly measurement periods the SPY advanced and the VIX declined, it is a little bit easier to swallow the performance of the two pioneering VIX ETPs.

[source(s): Yahoo, thinkorswim/TD Ameritrade, VIX and More]

In spite of some of the concerns expressed about the performance of VXX and VXZ in this space as early as the first half of 2009, VXX is still the #1 VIX ETP in terms of assets at $1.043 billion, while VXZ is in the #8 slot at $57 million.

To reiterate what I have maintained since their launch, VXX and VXZ are products that are suitable for short-term long volatility positions or for longer-term holding periods under certain market conditions. For those who are interested in more information, the links below should provide some excellent jumping off points.

All investors are encouraged to carefully study the prospectus of VXX and VXZ and more generally of all VIX and volatility-based exchange-traded products.  I also strongly encourage potential investors in this space to spend some time learning the intricacies of VIX futures, contango, roll yield and other related subjects.

Related posts:

Disclosure(s): short VXX at time of writing

Monday, January 21, 2013

New Updates for Newsletter and EVALS

This is a quick update to let readers know that I have recently posted detailed updates for the VIX and More Subscriber Newsletter as well as for VIX and More – EVALS, which is essentially a model portfolio based on VIX exchange-traded products that complements the newsletter.

Launched in March 2008, the VIX and More Subscriber Newsletter is published weekly and provides general market commentary, an asset class outlook and an explanation of my current investment thesis, as well as a more detailed analysis of market sentiment, volatility, the VIX futures term structure, and trading opportunities in the volatility space. Over the course of the past year or two, there has been an increased emphasis on various ways to trade the VIX ETPs, including the use of several proprietary indices to evaluate the timeliness of selected trading approaches. One feature that has been popular since the launch of the newsletter is the Stock of the Week. In the Q3 Newsletter Update I discussed the Stock of the Week selection process in some detail; in the recently completed Q4 Newsletter Update, I elaborate on the performance of the Stock of the Week in 2012 (up more than 100%) and also talk about four proprietary indices I use to evaluate the timeliness of selected VIX ETP trading strategies.

VIX and More EVALS was re-launched in November 2011 as a model portfolio that trades the VIX ETPs and a handful of other ETPs with a volatility component. The EVALS Q4 Update details performance data, risk-adjusted performance data, trading data, etc. for a model portfolio that posted a gain of 62% in 2012. Additional information can be gleaned from the EVALS One-Year Summary and Performance Update, as well as previous posts, such as EVALS Relaunches, Now Focusing on VIX Exchange-Traded Products.

In keeping with tradition, my intention is to limit the content related to the newsletter and EVALS in this space and encourage readers who are interested in additional details and subscription information to check out:

Related posts:

Disclosure(s): none

ZIV Starting to Gain Momentum

One year ago, I wrote ZIV Undeservedly Neglected when ZIV was trading about 5,000 shares per day and was not even on the radar of many investors who follow the VIX exchange-traded products space. In the land of inverse VIX-based ETPs, it seemed as if XIV was destined to grab all the headlines and the glory, with ZIV relegated to distant also-ran status. Frankly, I was somewhat concerned that ZIV was an ETP with a great deal of potential that might be shuttered due to neglect long before mainstream investors had an opportunity to discover its charms.

One year later, ZIV is still struggling to find adherents, trading approximately 60,000 shares per day as of late, while its performance has become even more difficult to ignore. Over the past year, ZIV is up 103%; and during that period it had a maximum drawdown of only 19%, as the graphic below illustrates. Of course, one can never cut and paste past performance into the future with any degree of certainty, but the record over the course of the past year points toward the potential of ZIV, neglected or otherwise.

[source(s): ETFreplay.com]

A year ago, I summarized some of my thinking on ZIV as follows:

“I am frankly surprised by the lack of interest investors have shown in ZIV, the VelocityShares Daily Inverse VIX Medium-Term ETN. In a nutshell, ZIV has many of the same benefits of long XIV and/or short VXX positions, with much less risk. Specifically, ZIV benefits from negative roll yield about 65% of the time, with VIX futures data going back to 2004 indicating that the annual benefit due to negative roll averages out at more than 20% per year. With XIV getting all the attention, I wonder if investors are aware that XIV is down and ZIV is up since the two products were launched.

Of course, like XIV, ZIV is exposed to sharp spikes in the VIX, as the chart below reflects. It is worth noting, however, that when the VIX spikes, ZIV can be expected to lose value at about half the rate of losses in XIV. For example, while XIV was falling 75%, ZIV was down 42%.  It bears repeating that one of the key features of inverse volatility products is that the potential for large short-term losses is significant, even though the long-term prospects are promising.”

Going forward, ZIV is going to have to make it or break it on its own merits, but for those few who have enjoyed the ride for the past year, it is clear that the potential is enormous – at least under certain market environments.

Related posts:

Disclosure(s): long XIV and ZIV, short VXX at time of writing

Friday, January 18, 2013

The Inverted Percentile VIX

Of the many reasons that investors have a tendency to struggle with an interpretation of the VIX, one of the most obvious is an issue of orientation: for the most part, the VIX moves in the opposite direction of stocks. Frankly, it is difficult to appreciate some of the nuances of an upside-down world unless you spend a lot of time hanging upside down looking out at the world, like a bat.

It is partly for this reason that I created the “inverted VIX” back in August 2007. At that time, the VIX had just spiked into the mid-20s only two months after having traded in the 12s. The chart below is an updated version of the inverted VIX over the course of the past year and demonstrates that for the most part, the SPX and the inverted VIX track fairly closely, though there are times, such as just prior to the fiscal cliff denouement, when the VIX sometimes strikes out on its own path.

[source(s): StockCharts.com]

Today we are seeing a VIX of about 12.50 – the lowest the index has been since June 2007 – and once again investors are grappling for the proper context. Let me throw a new concept into the mix that may help: the inverted percentile VIX, a distant cousin of the inverted VIX. The way to think about the inverted percentile VIX is in terms of the lifetime of VIX values, in which a VIX of 12.50 is in the 12.2 percentile. The inverse of that is the 87.8 percentile, which corresponds with a VIX of 28.67. Now I am guessing that for most investors a VIX of 12.50 feels much lower than a VIX of 28.67 feels high. Statistically they are almost identical in terms of being outliers, so if a 28.67 VIX doesn’t sound like a scary high number, then a VIX of 12.50 should not sound like a scary low number that is reflecting too much complacency.

Investors may wish to consider recalibrating their emotions and expectations or, failing that, take advantage of the relatively low VIX by buying some VIX calls so as to profit when the rest of the world comes to the realization that a VIX in the 12s is making them too nervous. Keep in mind, however, that current 10-day historical volatility of the SPX is in the 5s, so that number would have to double just to be able to support the current level of the VIX going forward.

Related posts:

Disclosure(s): none

Monday, January 7, 2013

Investor Fears Pivot to U.S. Deficit and Debt Ceiling Following Cliff Deal

Just one week after Democrats and Republicans cobbled together a last-minute fiscal cliff deal, investors turned their focus to the next battleground in the fiscal crisis, tabbing the U.S. deficit and debt ceiling as their #1 concern in the VIX and More weekly fear poll. Fears associated with governments and politicians polled a distant second, while ongoing worries related to weak corporate earnings finished in third place, one day before Alcoa (AA) unofficially kicks of the Q4 earnings reporting season.

The two issues that dominated the fear poll during the last quarter seem to have receded from the consciousness of most investors. While the legacy of the fiscal cliff lives on in the debt ceiling discussions, the immediate threat has passed. Meanwhile, in spite of warnings from the likes of Angela Merkel, concerns related to the European sovereign debt crisis remain at low levels and continue to decline.

On the institutional front, one of the residual effects of the fiscal cliff is a persistent worry that the fiscal cliff is merely a symptom of a dysfunctional bi-partisan government with a newfound affection for brinksmanship. On the other hand, worries about excessive central bank intervention are falling, no doubt helped in that regard by the recent FOMC minutes from the December 11-12th meeting.

With the VIX posting a record one-week decline last week, it is reasonable to conclude that investor worries about the fiscal cliff were of a much higher magnitude than those related to the U.S. debt ceiling and deficit. In fact, there are some divergent opinions about the relationship between the declining VIX and the fiscal cliff deal. For more on this subject, check out the comments from Jared Woodard of Condor Options in The Market Is As Nervous as Ever About Austerity Fetishisms, in which Jared picks up on a theme from a recent note by Alec Phillips of Goldman Sachs (GS).

Once again, thanks to all who participated in this weekly poll.

Related posts:

Disclosure(s): none

Friday, January 4, 2013

VIX ETP Performance in 2012

For anyone who pays attention to the VIX exchange-traded products space, 2012 was the year of the inverse (short) VIX futures ETP. The graphic below recaps the performance of the VIX ETPs that were trading as of the end of 2012 and it is easy to see that if you were long the inverse products (XIV, SVXY, ZIV, etc.) and were able to hold on to these positions during volatility storms such as the Greek elections, yield spikes on the sovereign debt of Italy and Spain, the fiscal cliff, etc. (all of which required nerves of steel and a creative risk management approach), then 2012 was a very good year for you. If not, then let the performance ups and downs be a reminder that most of the VIX ETPs are not well-suited for mainstream investors.

Instead of going into too much detail about the performance and reiterating much of what I have already said in the past, I encourage readers to investigate the links below, which include some predictions about future price moves and risk-reward ratios that have been borne out by the events of 2012.

If your new to this product space, perhaps the first place you should begin your research is with posts tagged with labels such as contango, roll yield and term structure – subjects that I have been writing about since the first VIX ETPs were launched, three years ago this month.

[Note that there are no performance numbers for VIXH or PHDG, as these products were launched during the year and have not yet accumulated full-year performance data.]

Related posts:

Disclosure(s): long XIV, SVXY and ZIV at time of writing

Wednesday, January 2, 2013

Guest Columnist at The Striking Price for Barron’s: The Case for Options Trading

Once again I am delighted to have an opportunity to serve as a guest columnist for The Striking Price on behalf of Steven Sears at Barron’s. While the title of the column is The Case for Options Trading, the focus of the article tilts in the direction of selling options and lists some of the reasons why new and relatively inexperienced options traders should invest some of their time during the coming year to learn more about selling puts and calls – and not just defined risk positions, but naked (uncovered) options as well.

The Barron’s article lays out some of the rationale behind my thinking, but this is a topic I plan to return to on a regular basis that dovetails with some related subjects I have been discussing in this space and are highlighted in the links below.

Related posts:

A full list of my Barron’s contributions:

Disclosure(s): none

The Year in VIX and Volatility (2012)

Every year I assemble a chart that is my retrospective look at the year in volatility. While 2012 was the first year since 2006 that the VIX failed to make it out of the 20s, this was not due to an absence of threats to the stock market.

During the first half of the year, the euro zone was the primary concern for most investors, with the events surrounding the two nail-biting elections in Greece haunting the markets from April through June. With Greece off of the front page, focus of the European sovereign debt crisis shifted to unsustainable government debt yields in Spain and Italy, which only began to turn around after Mario Draghi pledged to do “whatever it takes” to save the euro in July.

Meanwhile, markets in the United States were relatively calm due to the repeated intervention of the Fed, which offered up QE 2.5, QE3 and QE4. The global economy also found support in the form of central bank stimulus plans from China, Japan and the euro zone.

The last hurrah for the VIX and volatility in 2012 was the fiscal cliff, which was largely overlooked during the U.S. elections, but dominated the headlines even before the last vote was counted. The fiscal cliff issue remained the #1 source of concern for investors throughout the balance of the year and had the VIX moving counter to its usual direction for most of December.

As 2013 dawns, fears related to the fiscal cliff are plummeting and dragging the VIX down with it, but clearly the issues that have kept the financial markets on edge for the past few years are not yet behind us and unseen risks are always lurking just over the horizon.

[source(s): StockCharts.com]

Related posts:

Disclosure(s): none

Monday, December 31, 2012

Top Posts of 2012

Every year I tabulate the most-read posts in this space as I find this exercise to be an excellent way to identify the issues that readers are interested in and also to see how these issues evolve over time. These most-read posts also serve as easily accessible repositories of high-quality material for the benefit of new readers and long-term readers alike.

While 2012 was a slow year for the VIX (the first time the VIX didn’t make it into the 30s since 2007), it proved to be an exciting time for the broader volatility products space. Looking just at the titles of the top 25 posts below, an astonishing 9 of them reference TVIX or UVXY in the title, reflecting strong reader interest in the +2x volatility products that I called “day trading rocket fuel” back in January 2011.

The posts below represent those that have been read by the highest number of unique readers in 2012. Farther down there are links to similar lists going back to 2008, along with several other “best of” type posts that I have flagged for archival purposes.  Don’t necessarily start at the top and work your way down until you get bored.  For the record, I think #25, Volatility During Crises is one of the top two posts of the year.  I’m not sure about #1, but Cheating with Partial Hedges, which didn’t even make this top 25 list, also has to be considered a strong candidate.

Last but not least, each year I also attach the hall of fame label to a handful of posts that I believe have particularly compelling and/or original content, regardless of readership.

Happy New Year!

Related posts:

Disclosure(s): short UVXY at time of writing

DISCLAIMER: "VIX®" is a trademark of Chicago Board Options Exchange, Incorporated. Chicago Board Options Exchange, Incorporated is not affiliated with this website or this website's owner's or operators. CBOE assumes no responsibility for the accuracy or completeness or any other aspect of any content posted on this website by its operator or any third party. All content on this site is provided for informational and entertainment purposes only and is not intended as advice to buy or sell any securities. Stocks are difficult to trade; options are even harder. When it comes to VIX derivatives, don't fall into the trap of thinking that just because you can ride a horse, you can ride an alligator. Please do your own homework and accept full responsibility for any investment decisions you make. No content on this site can be used for commercial purposes without the prior written permission of the author. Copyright © 2007-2023 Bill Luby. All rights reserved.
 
Web Analytics