Showing posts with label fear. Show all posts

Tuesday, November 8, 2016

Top VIX Crushes in History

Yesterday’s sharp downward move in the VIX gave me a reason to tweet that the volatility crush as seen in the SPX and VIX was among the top 25 in history.  Upward pressure on the VIX toward the end of the session dropped the VIX down to the 30th largest VIX decline in history, but along the way the Twitterati raised a number of questions about volatility crushes and the VIX as a measurement tool of broad market volatility crushes.

Since I have never seen any data related to the VIX and volatility crushes before, I thought this might be an opportunity to present some of my data and talk about the findings.  In the chart below, I have captured the 25 largest one-day declines in the VIX since 1990 and have presented data showing the forward performance of the SPX in periods from one to 100 days and I have also added some brief commentary regarding the causes.  In some cases I link the volatility crush to a previous VIX spike and use some explanatory shorthand in the process.  For instance, the top crush day, May 10, 2010, followed 2 days after the 21st largest VIX spike (“2d+ #21”).


[source(s):  CBOE, VIX and More]

Of course, most of these volatility crush days coincided with huge jumps in the SPX, but there are some interesting exceptions, not the least of which was the 0.04% decline in the SPX back on April 11, 1990.  That just happens to be the only day for which I cannot find any obvious explanatory catalyst – to the extent that a 0.04% in stocks can actually have a catalyst – but given the proximity to the upcoming Gulf War, my guess is that some sort of news related to Iraq played into this event.
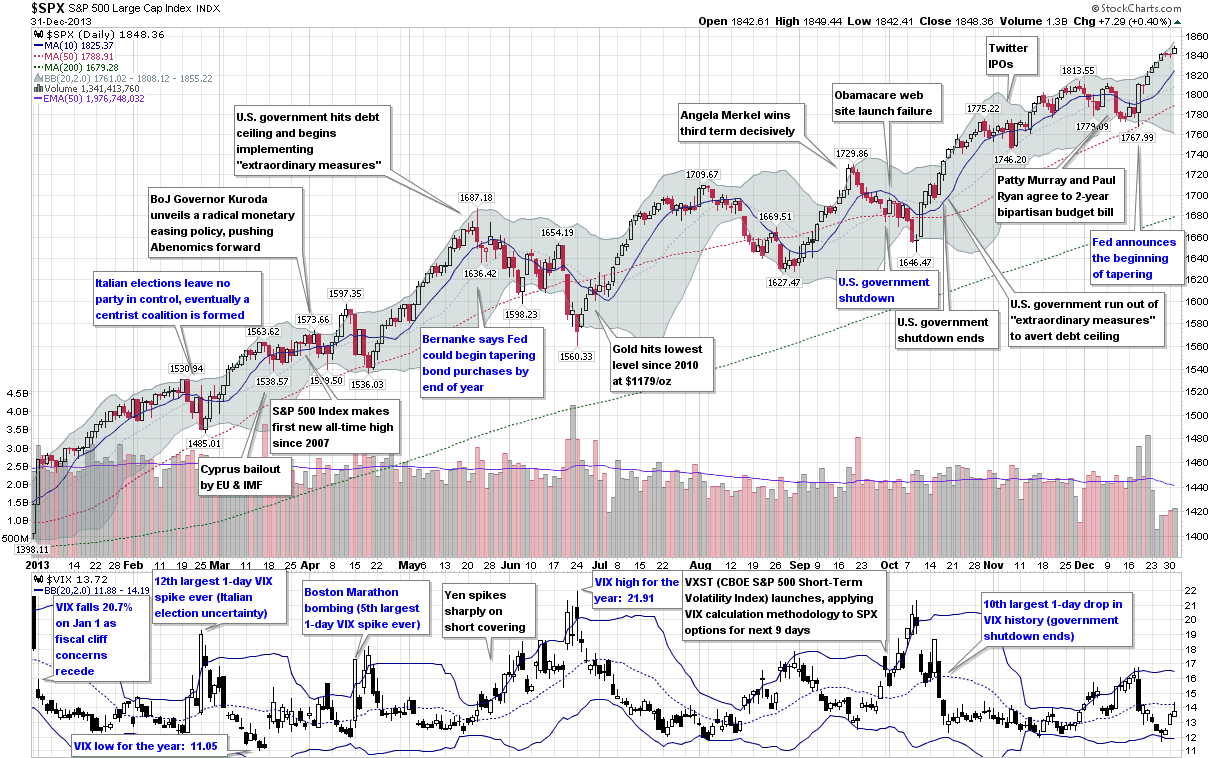
Note also how many of these volatility crush instances follow other important market-moving high fear events one or two days later, in true mean reversion fashion.  Examples on this list range from the flash crash, Greece, Lehman Brothers and Bear Stearns to several VIX all-time highs, Russian political and economic crises, the Boston marathon bombing, etc.

Things get even more interesting if you compare the top 25 VIX crushes to the top 25 VIX spikes in history (for an identical table recapping the top 25 spikes refer to Last Two Days Are #5 and #6 One-Day VIX Spikes in History.)  For starters, the top 25 VIX spikes all move up at least 31%, while none of the top 25 VIX crushes managed to eclipse the 30% decline level.  Also note the differences in the mean reversion predictive value of spikes versus crushes.  In general, the performance of the SPX following VIX crushes is modestly lower than that of the SPX in general.  On the other hand, the performance of the SPX following VIX spikes is generally better than the SPX in general – much more so if the September 29, 2008 outlier is dropped from the data set.

Another point that I think is worth making speaks to the overall changes in the volatility space.  The critical data point is that 11/25 of the top 25 VIX crushes happened since the beginning 2010, while 14/25 of the top 25 VIX spikes have occurred during the same period.  This means that we have had as much in the way of big volatility moves in the list seven years as in the previous twenty years of VIX data.  In other words, the volatility landscape is changing and the rise of VIX futures and VIX ETPs are no doubt an important part of that change.

For those who may be interested, you can always follow me on Twitter at @VIXandMore

Related posts:


Disclosure(s): the CBOE is an advertiser on VIX and More

Sunday, November 6, 2016

VIX Sets New Record with Nine Up Days in a Row

Over the course of the past few days I have been tracking the slow grind upward in the VIX on Twitter, noting that it had been up seven, eight and eventually nine (as of Friday) days in a row.  As the VIX is a mean reverting animal, I find it interesting that until Friday, the VIX had never risen for nine consecutive days in 27 years of VIX data.  Perhaps even more interesting, during the same period, the VIX had fallen nine days in a row on nine separate instances and even managed to fall ten days in a row on three occasions.  For those who may be wondering, this is yet another data point supporting the idea that VIX mean reversion is more robust following a sharp VIX spike than a sharp VIX decline.

Whenever the VIX makes an unusual move, I am bombarded by variations along the lines of, “That’s nice, but what does it mean for the markets?"  As much as the doomsayers hate to hear this, fear is almost always a great fade, particularly when you have a little patience.  Rather than talking about the matter in theoretical terms, however, I thought I would let some numbers do the talking.  In the table below, I have assembled the fifteen instances in which the VIX has been up at least seven days in a row and have calculated the mean and median performance in the VIX for seven different intervals ranging from one day to 100 days.


[source(s):  CBOE, VIX and More]

Not surprisingly, the mean and median performance of the VIX following these 15 streaks and 1-100 days is uniformly negative.  The data set includes data from Thursday and Friday, which show increases in the VIX and render the one-day performance relatively weak when compared to the rest of the measurement periods.  That being said, mean reversion is evident from the first day all the way through the five-month period that forms the most distant measurement date in this table.

Once again, these findings are consistent with dozens of similar tables presented in these pages over the years that show fading a VIX spike is, on average, an excellent trade opportunity, assuming elevated levels of volatility will persist.

Returning to theoretical territory, if you think about it, what is the type of environment that is likely to cause the VIX to move higher every day for a week and a half or so?  Typically it is event risk in the form of a known event on the calendar that investors obsess about and become increasingly anxious about as it draws ever nearer.  Think of Fed meetings (The VIX and the Pre-FOMC + Post-FOMC Trades), Greece’s elections or key Parliament votes, Congressional votes related to the fiscal cliff, etc.  [See A Conceptual Framework for Volatility Events for more background and context.]

Contrast fretting about the scheduled event risk with something that comes out of nowhere, like the yuan devaluation, Ebola virus, Fukushima, various terrorist incidents and even the Arab Spring.  These dark gray swans blindsided investors and caused a sudden sharp VIX spike – the kind whose steepness cannot be sustained over the course of 1 ½ weeks.

A Twitter reader asked about volatility crushes and their timing.  In a nutshell, a volatility crush is the opposite of a volatility spike and generally happens after a scheduled event is over.  In addition to the macro events listed above, one often sees a volatility crush following an earnings report.  For reasons discussed in A Conceptual Framework for Volatility Events, a volatility crush is much less likely to occur in the context of an unscheduled event with no notice and an uncertain duration.

Today we saw an excellent example of a volatility crush following the announcement by James Comey that the recently discovered batch of emails contained no new evidence in the Hillary Clinton private email server case, reaffirming that there would be no criminal charges against Clinton.  Front month (November) VIX futures are down 12% on this news.

For those who may be interested, you can always follow me on Twitter at @VIXandMore

Related posts:


Disclosure(s): the CBOE is an advertiser on VIX and More

Wednesday, September 2, 2015

China Growth and Market Structural Integrity Top List of Fear Poll Concerns

After a hiatus of almost a year (the October 2014 pullback, to be exact), I have reprised the VIX and More Fear Poll in an attempt to get some insight into which issues have been responsible for bring fear back into the investing equation and in so triggering the highest VIX spike (53.29) outside of the 2008-09 financial crisis and the #5 and #6 one-day VIX spikes ever on consecutive days.

In the chart below, I have summarized the top ten responses from almost 400 voters, covering 40 countries over the past two days.  The question:  “Which of the following makes you most fearful anxious or uncertain about the stock market?”

VIX and More Fear Poll results 090215

[source(s): VIX and More]

I should note that Tuesday’s responses had “Market structural integrity (high-frequency trading, flash crashes, exchange stability, etc.)” as the #1 concern, but a late flurry of votes today for “China – weak economic growth” put China concerns over the top. Combining Chinese growth concerns with concerns about a bubble in Chinese stocks and/or housing makes it a landslide in favor of all things China. Without too much of a stretch, one could also lump in the likes of currency problems, deflation, low crude oil prices and falling commodities prices in general into a broader China-related bucket and suddenly the China + ripple effect accounts for about 50% of the votes.

As always, I love to see how the American view of the world contrasts with those non-U.S. respondents. This time around, the area most overemphasized by Americans relative to the rest of the world is, in classic Americentric myopia fashion…”U.S. – weak economic growth,” which 8.7% more Americans label as their #1 concern than their non-U.S. counterparts. Conversely, the biggest blind spot for Americans – at least relative to the concerns of the rest of the world – is commodities prices, which Americans underweight by 5.1%. A close second in the American myopia sweepstakes is Chinese bubbles in stocks and/or housing. I do not find the commodities oversight to be surprising, but certainly the relatively low concern about Chinese bubbles is unexpected.

For those who have not seen some of the earlier incarnations of this poll, these dataeback to 2012 and chronicle a U.S. public that was so obsessed with the fiscal cliff that they did not fully appreciate the gravity of the European sovereign debt crisis.

Related posts:

Disclosure(s): none

Sunday, January 25, 2015

The Year in VIX and Volatility (2014)

This is the seventh year in a row I have offered a retrospective look at the year in VIX and Volatility, which is my attempt to cram some of the highlights of the year in volatility onto one eye chart graphic with a (somewhat) manageable number of annotations.

In aggregate, 2014 was a very quiet year for the VIX, with a mean close of just 14.19 for the year, which is the lowest the VIX has been since 2006 and third lowest since 1995. On the other hand, as I recently documented, VIX spikes were common last year, with 2014 registering the third highest number of 20% VIX spikes since the beginning of VIX data, in 1990. In short, the VIX was susceptible to large spikes, but these were typically followed by strong mean-reverting declines. For example, the peak VIX of 31.06 on October 15 was the highest VIX reading since 2011, yet just six weeks later the VIX was back in the 11s.

When asked in October what they perceived as the biggest threat to stocks, respondents to the VIX and More fear poll pointed to the end of quantitative easing and the removal of the Fed safety net as their top concern, with Ebola narrowly edging out the much more nebulous “market technical factors” for the second slot. As best as I am able to determine, it was the panic associated with fears of an Ebola epidemic that took an already elevated VIX and pushed it up into the 30s.

At various times during the year, Ukraine/Russia, crude oil, ISIS/ISIL, Israel/Gaza, the Fed and the European Central Bank all managed to increase anxiety and perceptions of risk among investors. Also, the narrow miss in the vote for Scottish independence created turmoil in the United Kingdom and across the euro zone, but managed to avoid morphing into another nationalist crisis. Early in the year, there was a currency crisis in emerging markets that was triggered by (unfounded, in retrospect) concerns about higher interest rates in the U.S. Throughout the year there were concerns about valuations and excesses momentum trading in the likes of biotechnology, social media, internet and solar stocks. To some extent, these concerns peaked in April (see The Correction as Seen in the ETP Landscape for additional details), only to return periodically throughout the balance of the year.

The Year in VIX and Volatility 2014

[source(s): StockCharts.com, VIX and More]

Last year at this time, the prevailing worries were focused on whether or not Fed Chair Janet Yellen was leaning toward a more hawkish stance, the inevitable march to higher interest rates in the U.S., the weakening of emerging markets currencies and the potential fallout from the Fed’s tapering of bond purchases. In retrospect, investors were largely worrying about the wrong things.

The first few weeks of 2015 have seen Greece, Saudi Arabia and Ukraine back in the spotlight, with the Swiss National Bank and European Central Bank dominating news on the central banking front. If the past is any guide, the big issue for 2015 has yet to rear its ugly head, whether it turns out to be a gray, charcoal or black swan.

Related posts:

Disclosure(s): none

Thursday, October 16, 2014

Fear Poll: Fed/QE, Ebola and Technicals Top Worry List

Stocks may be in the process of putting in a bottom, but with the VIX hitting 31.06 yesterday at the same time VIX futures were setting new volume records, investor fear and anxiety is as high as it has been since the 2011 European sovereign debt crisis.

As the VIX and More Fear Poll results reflect, the current situation is particularly difficult for investors to grapple with because there is so much disagreement about what the biggest worry is and how some of these fears may be connected.

In the chart below, I have summarized the almost 400 votes from some 35 countries, with the U.S. accounting for 65% of all respondents.

It is worth noting that the responses appear to be somewhat headline driven, as yesterday Ebola topped the list of worries, only to be supplanted by concerns about the impact of the Fed ending quantitative easing and in so doing removing the safety net that has helped keep liquidity high, volatility low and investors more confident. I also find it particularly interesting that “market technical factors (breach of support, end of trend, weak internals, etc.)” are so important to a broad range of investors, which raises the question of whether technicals are more of a cause or effect in the recent downturn.

Looking at global economic weakness, slightly more investors expressed concern about the U.S. economy than that of the euro zone, with concerns about the Chinese economy a distant third.

In these types of polls, I am always interested to see how U.S. respondents differ from those outside of the U.S. In the current market environment, U.S. respondents tend to place more emphasis on the weak U.S. economy and the Ebola virus, while paying less attention to currency issues and China. Some of the detailed results certainly have a whiff of provincialism, yet it remains to be seen whether the global or Americentric perspective does a better job of honing in on what to focus on – a subject I will delve into at a later date.

For those who might be interested in the results of prior VIX and More Fear Poll data, the links below should be a helpful reference.

Last but not least, many thanks to everyone who participated in this poll, which I intend to periodically reprise as market conditions warrant.

VAM Fear Poll 101614

[source(s): VIX and More]

Related posts:

Disclosure(s): none

Sunday, January 26, 2014

The Year in VIX and Volatility (2013)

This is the sixth year in a row I have offered a retrospective look at the year in VIX and Volatility, which is my attempt to cram the highlights of the year in volatility onto one graphic with a manageable amount of annotations.

In terms of equity volatility and specifically the VIX, 2013 was the story of a persistent bull market in stocks and very little in the way of implied or realized volatility, at least by historical standards. In fact, the VIX’s high water mark of 21.91 was the second lowest annual high point since 1995, eclipsed only by the Greenspan liquidity flood in 2005. Similarly, the average VIX in 2013 was just 14.23, considerably lower than the long-term average, which is a shade over 20. The year only saw two days in which the SPX was up 2% or more and another two days in which the SPX was down at least 2%, the fewest number of such days since 2006.

Even though the numbers may not be impressive, there were still some significant events during the course of the year that were able to provoke substantial anxiety and fear, at least for the short-term. The year began with the Fiscal Cliff drama coming to an end and saw fear in the euro zone heat up after the Italian elections ended with a parliamentary deadlock and Cypriot banks triggered a joint EU/IMF bailout of Cyprus. The Boston Marathon bombings provided a jolt of terrorist fear in April and fears about Japan the future of Abenomics created huge volatility in the yen, with ripple effects felt across currency markets and in many related financial markets during May and June.

In the U.S., the Fed tapering scenarios dominated the investment landscape during the second half of the year and the debt ceiling crisis, government shutdown and entrenched bipartisan bickering cast many doubts about the potential for some huge self-inflicted wounds.

In the end, the SPX set 44 new all-time closing highs in 2013 and the VIX ended the year almost 24% below where it finished in 2012, though the Fiscal Cliff was responsible for most of that gap.

[source(s): StockCharts.com. VIX and More]

So far 2014 looks more interesting from a volatility perspective, but the year is young and the volatility story is always one of surprises in the form of swans with dark gray plumage.

Related posts:

Disclosure(s): none

Thursday, January 2, 2014

Was the VIX Too Low in 2013? No…

There was a time when investors would generally fret about the VIX being “too high” and the resulting possibility that there was some sort of unseen threat to the financial markets that was not showing up on their radar. In the last few years, the situation has reversed and now I find investors expressing more concern about a low VIX more often than a high VIX. Yes, there are some (many, actually) who start to get anxious and fearful when the markets are not reflecting as much anxiety and fear as they think they should. For those who still think about the battle scars from 2008, this phenomenon seems to be a recurring issue.  (See my posts on disaster imprinting for more information on this.)

So…was the VIX too low in 2013? In order to answer this question, I am updating a chart I last presented in October 2012 in Ratio of VIX to Realized Volatility Higher than Any Year Since 1996.

As the chart shows, both the (mean) VIX and 10-day historical volatility (HV) of the S&P 500 index were are relatively low levels during 2013. More importantly, the VIX maintained an average premium of 34% to the 10-day HV of the SPX during the year, which is right in line with historical norms going back to 1990 of a premium of about 35%.

[source(s): CBOE, Yahoo]

While I have used data provided by the CBOE going back to 1990 in calculating historical norms, I think it is worth noting that from 1990-1996, the VIX typically had a much higher premium relative to historical volatility in the SPX than it has in more recent years, so whereas the long-term VIX premium to HV stands at about 35%, the post-1996 average premium is closer to 26%. As a result, if you really need to drive home the point that the VIX was “too low” in 2013, you can always trot out the post-1996 data, but otherwise consider the VIX to be just about exactly where it should have been – at least in relation to historical volatility – during the past year.

Last but not least, the chart also illustrates that while the VIX and SPX HV do have a tendency to trend over the course of several years, the ratio of the two has a much more random movement and is therefore much more difficult to predict for 2014.

Related posts:

Disclosure(s): CBOE is an advertiser on VIX and More

Monday, March 11, 2013

Lowest VIX Close Since Day Before Biggest VIX Spike Ever

I’m generally not one for sensationalist headlines, fear-mongering or otherwise stirring up trouble unnecessarily, but when facts line up in a manner that I know others will find interesting, I do feel an obligation to point that out.

So…at the risk of being splashed all over the Zero Hedge comments stream I thought it worth noting that today the VIX closed at 11.56. While this marks the lowest close in the VIX in over six years, a surprising portion of this low VIX is the result of a calculation quirk I described earlier today in The VIX, Interpolation and the Roll. In other words, I would characterize today’s VIX as artificially low and considerably lower than the near-term VIX calculation (VIN).

That being said, there is no denying that the last time the VIX closed below today’s close was February 26, 2007, the day before The Biggest VIX Spike Ever, a 64% jump in one day.

Do I expect a new record VIX spike tomorrow? Hardly, though I should note that just two weeks ago today we did see the #11 all-time VIX spike for a single day.

What is more likely to happen is that the negative coefficient for the weighting of the far-term VIX calculation (VIF) will slowly dissipate over the course of the week and that in itself should lift the VIX about three-quarters of a point. Throw in a just one or two days of declining stocks triggering the purchase of SPX puts for portfolio protection and it would be very easy to see the VIX up more than 20% from its current level by the end of the week.

Looking back at the concerns that dominated my fear poll a couple of months ago, most of these have dramatically receded. For this reason, it looks like it will take one of those unexpected threats to get the VIX airborne once again.

Related posts:

Disclosure(s): none

Monday, January 7, 2013

Investor Fears Pivot to U.S. Deficit and Debt Ceiling Following Cliff Deal

Just one week after Democrats and Republicans cobbled together a last-minute fiscal cliff deal, investors turned their focus to the next battleground in the fiscal crisis, tabbing the U.S. deficit and debt ceiling as their #1 concern in the VIX and More weekly fear poll. Fears associated with governments and politicians polled a distant second, while ongoing worries related to weak corporate earnings finished in third place, one day before Alcoa (AA) unofficially kicks of the Q4 earnings reporting season.

The two issues that dominated the fear poll during the last quarter seem to have receded from the consciousness of most investors. While the legacy of the fiscal cliff lives on in the debt ceiling discussions, the immediate threat has passed. Meanwhile, in spite of warnings from the likes of Angela Merkel, concerns related to the European sovereign debt crisis remain at low levels and continue to decline.

On the institutional front, one of the residual effects of the fiscal cliff is a persistent worry that the fiscal cliff is merely a symptom of a dysfunctional bi-partisan government with a newfound affection for brinksmanship. On the other hand, worries about excessive central bank intervention are falling, no doubt helped in that regard by the recent FOMC minutes from the December 11-12th meeting.

With the VIX posting a record one-week decline last week, it is reasonable to conclude that investor worries about the fiscal cliff were of a much higher magnitude than those related to the U.S. debt ceiling and deficit. In fact, there are some divergent opinions about the relationship between the declining VIX and the fiscal cliff deal. For more on this subject, check out the comments from Jared Woodard of Condor Options in The Market Is As Nervous as Ever About Austerity Fetishisms, in which Jared picks up on a theme from a recent note by Alec Phillips of Goldman Sachs (GS).

Once again, thanks to all who participated in this weekly poll.

Related posts:

Disclosure(s): none

Wednesday, January 2, 2013

The Year in VIX and Volatility (2012)

Every year I assemble a chart that is my retrospective look at the year in volatility. While 2012 was the first year since 2006 that the VIX failed to make it out of the 20s, this was not due to an absence of threats to the stock market.

During the first half of the year, the euro zone was the primary concern for most investors, with the events surrounding the two nail-biting elections in Greece haunting the markets from April through June. With Greece off of the front page, focus of the European sovereign debt crisis shifted to unsustainable government debt yields in Spain and Italy, which only began to turn around after Mario Draghi pledged to do “whatever it takes” to save the euro in July.

Meanwhile, markets in the United States were relatively calm due to the repeated intervention of the Fed, which offered up QE 2.5, QE3 and QE4. The global economy also found support in the form of central bank stimulus plans from China, Japan and the euro zone.

The last hurrah for the VIX and volatility in 2012 was the fiscal cliff, which was largely overlooked during the U.S. elections, but dominated the headlines even before the last vote was counted. The fiscal cliff issue remained the #1 source of concern for investors throughout the balance of the year and had the VIX moving counter to its usual direction for most of December.

As 2013 dawns, fears related to the fiscal cliff are plummeting and dragging the VIX down with it, but clearly the issues that have kept the financial markets on edge for the past few years are not yet behind us and unseen risks are always lurking just over the horizon.

[source(s): StockCharts.com]

Related posts:

Disclosure(s): none

Monday, December 31, 2012

Just a Change of Venue? (Fears About U.S. Deficit/Debt Ceiling Replacing Fiscal Cliff Worries)

With the U.S. fiscal cliff negotiations going down to the wire, it is not surprising that fears related to the fiscal cliff topped the list of investor threats to the stock market for the eleventh week in a row in the VIX and More weekly fear poll. Fears associated with governments and politicians as well as excessive central bank intervention polled in second and third place, respectively.

What I found particularly interesting is the sudden rise in fears related to the U.S. deficit and debt ceiling, as investors appear to be concluding that the current fiscal cliff negotiations are now just one more skirmish in the ongoing war between Democrats and Republicans regarding how to address the U.S. budget deficit. With Treasury Secretary Timothy Geithner saying that the U.S. will hit its debt ceiling today and have to resort to extraordinary measures to keep under the legal limit, the stage is set for the next pitched battle when these extraordinary measures can no longer do their trick, in about two months.

So what problems will a fiscal cliff deal resolve? Part of the answer to this question depends upon whether the pending (we hope) deal is merely a stopgap measure or addresses some of the more politically thorny underlying issues related to the budget deficit in a comprehensive way. Of course the trick is structuring the deal in such a way that it does so in a manner which limits any negative impact on the economy.

Stay tuned. A fiscal cliff deal may only signal a change of venue and redirect investor fears to the next battleground.

Once again, thanks to all who participated in this weekly poll.

Related posts:

Disclosure(s): none

Monday, December 24, 2012

Fiscal Cliff Widens Lead as #1 Investor Concern

Extending a recent trend, the U.S. fiscal cliff topped the list of investor threats to the stock market for the tenth consecutive week in the VIX and More weekly fear poll. Fears associated with excessive central bank intervention were a distant second, while more general concerns about government and politicians finished third in the poll.

The gap between the fiscal cliff and the runner-up issue was 10.6% this week, the largest in six weeks and the second largest since the inception of the poll some ten weeks ago.

For the second week in a row, geographical differences among the respondents were relatively small, with only minor differences between U.S. and non-U.S. respondents. The regional myopia that had separated U.S. and non-U.S. respondents on the relative importance of the fiscal cliff vs. the European sovereign debt crisis for most of the last three months appears to have subsided over the last two weeks, in conjunction with the widespread lessening of fears over the future of the euro zone.

Once again, thanks to all who participated in this weekly poll.

Last but not least, Merry Christmas, happy holidays and best wishes for a joyful, healthy, happy and profitable 2013!

Related posts:

Disclosure(s): none

Monday, December 17, 2012

Fiscal Cliff Continues to Top Fear Poll

In a week in which there appears to have been little progress in the U.S. fiscal cliff negotiations, investors continue to cite the fiscal cliff as the largest threat to the stock market in the VIX and More weekly fear poll. Fears related to government and politicians beat out concerns about excessive central bank intervention as the #2 issue, while anxiety related to the European sovereign debt crisis finished in a tie for fourth.

The poll marked only the third time in nine weeks that U.S. and non-U.S. respondents agreed on the top threat and was the first time that U.S. and non-U.S. respondents placed the top two threats in the same order. In fact, agreement on the order of the threats was the same through the top three.

In another sign that geographical proximity bias has receded, U.S. respondents gave more weight to the European sovereign debt crisis than non-U.S. respondents (the majority of whom are European), while non-U.S. respondents gave more weight to the fiscal cliff than U.S. respondents. In previous weeks, there had been strong evidence of regional myopia.

Another item of note, with last week’s dramatic change in Fed policy away from a timetable to targeted unemployment and inflation rates, one might expect the balance of fear to tilt more in the direction of inflation or deflation this week. Instead, there was a notable jump in concerns over both inflation and deflation, particularly from U.S. respondents.

It is reasonable to ask what might happen if there is a deal in the fiscal cliff in the next week or two. Will a deal also have a significant impact on concerns related to government and politicians or will concerns related to institutions persist and prove to be something more than an event-specific concern? Finally, if the fiscal cliff fears disappear with a deal, which new fears will bubble up to take its place? This week several respondents submitted write-in votes related to high-frequency trading (HFT) and algorithmic trading. Will this be the next fear to stalk the stock market?

Once again, thanks to all who participated in this weekly poll.

Related posts:

Disclosure(s): none

Monday, December 10, 2012

Fear Poll Respondents Focus on Fiscal Cliff, Dismissive of European Financial Crisis

For the eighth week in a row, concerns about the U.S. fiscal cliff topped the VIX and More weekly fear poll. Fears related to excessive central bank intervention nudged out concerns related to government and politicians as the #2 issue, but perhaps the most interesting development is the how much the anxiety related to the European sovereign debt crisis continues to subside.

From a geographical perspective, U.S. and non-U.S. respondents had a relatively low divergence of opinion this week. That being said, whereas U.S. respondents cited the fiscal cliff as the top concern, non-U.S. respondents were most concerned about excessive central bank intervention in the economy. Perhaps part of the fallout from the fiscal cliff negotiations is that U.S. respondents see governments and politicians as much more likely to be the top threat to the stock market, by a margin of 5.6% over non-U.S. respondents.

Interestingly, both U.S. and non-U.S. respondents expressed much less concern about the euro zone problems, with only 4.9% of U.S. respondents citing euro zones as the #1 concern, while 5.9% of non-U.S. respondents put the euro zone issues at the top of the list.

With the FOMC meeting scheduled to wind up on Wednesday, the fiscal cliff talks inching closer to that last day on which legislation can be introduced in Congress for the year (December 18th, based upon a December 21st recess) and Alcoa scheduled to report Q4 earnings and unofficially kick of the next earnings reporting season on January 8th, there is the potential for quite a few things to hit the fan in the coming month.

In spite of all these threats looming just around the corner, the VIX remains subdued and is still in a position to reinforce the notion that December Is the Cruelest Month…for the VIX.

Once again, thanks to all who participated in this weekly poll.

Related posts:

Disclosure(s): none

Friday, December 7, 2012

Unusual Twist in VIX Futures Term Structure as of Late

Even with the U.S. fiscal cliff grabbing all the headlines and keeping the VIX from dipping under 15, I still thought I might be able to trot out my annual series of posts on the holiday effect (or calendar reversion):

As it turns out, fears related to the fiscal cliff have trumped the seasonal factors – at least so far – and the VIX futures term structure has twisted and turned in a decidedly unusual manner.

The graphic below shows the VIX futures term structure curve from November 27th (dotted red line) and again today (solid blue line), eight trading days later. Typically when there are changes in the term structure, the most extreme moves are in the front month (Dec) contract, the second largest move is in the second month (Jan) contract and so on down to the back month, which typically moves only about one third as much as the front month.

What makes the graphic below so interesting is that the front month contract is up slightly (actually up 0.05 points) while the market’s estimation of future implied volatility going out all the way to August has dropped at least 2.2% (Jul and Aug) and as much as 3.8% (Feb). What can we conclude about these changes in the VIX futures? Well, most likely investors are buying protection against a move in December (the VIX futures expire at the open on December 19th) and are selling longer-dated VIX futures contracts for February and other months in order to finance the cost of that protection. All things being said, the market is reflecting less risk in 2013, somewhat offset by a slight increase in risk and uncertainty for the next two weeks or so.

[source(s): CBOE Futures Exchange (CFE)]

Related posts:

Disclosure(s): none

Monday, December 3, 2012

Fear of Governments and Politicians Climb Rapidly as Euro Zone Worries Wane

While concerns about the U.S. fiscal cliff topped the VIX and More weekly fear poll for the seventh week in a row, the big story is that investors are increasingly more concerned about the governments and politicians who are tasked with finding the solutions to these crises than the crises themselves.

Even though it is a global concern, fears and anxieties related to governments and politicians is most evident in the United States, where governments and politicians outpolled the fiscal cliff by a margin of 27.9% to 26.7%. Frustrations over the actions (or lack thereof) of governments and politicians were only the #4 concern outside of the U.S., where the fiscal cliff polled in the #1 slot, followed by the European sovereign debt crisis and continued weak earnings.

Respondents across the globe now see enough progress in the euro zone that the financial crisis in Europe has been relegated to a second tier of worries.

Another development worth noting is the sudden disappearance of an Americentric bias in the fiscal cliff issue. Over the past six weeks U.S. based respondents have been 13.1% more likely than non-U.S. respondents to cite the fiscal cliff as their top concern. This week was the first week that non-U.S. respondents saw the fiscal cliff as a bigger fear than their U.S. counterparts. Of course if one were to attribute most of the anxiety over governments and politicians in the U.S. to the fiscal cliff, then the results of this poll might say more about how different populations see the root cause of the fiscal cliff issue than anything else.

As noted last week, if one adds up the fiscal cliff, euro zone, central bank and government + politicians responses, it is possible to pin some 75-80% of all investor fears on institutions such as central banks and governments, with the fiscal cliff and the euro zone financial crisis merely symptoms of a larger underlying problem.

Once again, thanks to all who participated in this weekly poll.

Related posts:

Disclosure(s): none

Monday, November 26, 2012

Fiscal Cliff Concerns Top Fear Poll, But Central Banks and Politicians Seen as Key Systemic Threats

Concerns about the U.S. fiscal cliff continued to top the VIX and More weekly fear poll, while investor anxiety regarding weak earnings, Israel and China all declined substantially.

The biggest change in investor fears over the course of the past two weeks is a growing trend toward the mistrust of the role of institutions such as central banks and governments in economic matters. Concerns about central bankers and politicians are significant enough to poll in the #3 and #4 spots for all respondents, but rate even higher in the U.S., where government and politicians were the #2 concern and excessive central bank intervention worries garnered the #3 spot.

If one considers the fiscal cliff and the European sovereign debt crisis (still polling in the #2 slot on a global basis) to be situations that have been caused by and/or exacerbated by central banks, governments and politicians, then it is not too difficult to pin some 75-80% of all investor fears on central banks and governments.

As noted in previous weeks, the persistent Americentric bias shows no signs of abating. This week, for example, 12.4% more of the U.S. respondents cited the fiscal cliff as the top concern over the European sovereign debt crisis. For non-U.S. respondents, however, the fiscal cliff outpolled the European sovereign debt crisis by only 2.8%.

Once again, thanks to all who participated in this weekly poll.

Related posts:

Disclosure(s): none

Monday, November 19, 2012

Fiscal Cliff and European Sovereign Debt Concerns Recede, Earnings Worries Linger

Concerns about the U.S. fiscal cliff and the European sovereign debt crisis both declined over the course of the past week, as stocks made a concerted effort to establish a bottom, following an 8.9% decline in the S&P 500 index, according to the VIX and More weekly fear poll.

Even though the earnings reporting season is almost over, investors continued to express concern about weak earnings and guidance going forward, with earnings worries finishing a close third in the poll.

The biggest changes in investor sentiment have come in the form of growing discontent with institutions such as central banks and governments and concerns that their intervention in economic matters will have more of a negative than positive effect. Fears about excessive intervention on the part of central banks as well as more broadly with the role of governments and politicians were largely absent just two weeks ago. Taken together, this lack of trust with respect to the two influential policy-making institutions is now as big as concern as that of the fiscal cliff or the euro zone woes, as shown in the graphic below.

The persistent Americentric bias is still apparent. This week, for example, 8.5% more of the U.S. respondents cited the fiscal cliff as the top concern over the European sovereign debt crisis. For non-U.S. respondents, however, the European sovereign debt crisis outpolled the fiscal cliff by a margin of 3.2%.

Also of note from a geographical perspective, U.S. respondents were 1.8% more likely than non-U.S. respondents to tab excessive central bank intervention as their top fear and 5.9% more likely to point to government and politicians as their biggest concern. In addition to placing higher emphasis on the European sovereign debt crisis, non-U.S. respondents also expressed much more concern about China and deflation.

Once again, thanks to all who participated in this weekly poll.

Related posts:

Disclosure(s): none

Monday, November 12, 2012

Fear Poll: Fiscal Cliff Fears Spike, Concerns About Excessive Central Bank Intervention Rise

For the fourth week in a row, the U.S. fiscal cliff topped the list of investor fears about the stock market. With all the media attention heaped on the fiscal cliff since the election, it should come as no surprise that the fiscal cliff outpolled the second-place European sovereign debt crisis by 10.9%, the widest margin since the Fear Poll began four weeks ago.

Concerns about continued weak corporate earnings held on to the #3 spot, even as the earnings season winds down, while anxiety about problems related to excessive central bank interventions moved into the #4 slot. Among write-in votes, the biggest issue is frustration with government and politicians, which is certainly related to some of fears about how the fiscal cliff and euro zone problems will be resolved.

The Americentric perspective was once again in evidence this week, with U.S. respondents seeing the fiscal cliff as more concerning than the European sovereign debt crisis by a margin of 16.2%, while non-U.S. respondents saw the two issues as almost equally important, with the fiscal cliff winning out by only 1.8%. Interestingly, this parochialism seems to be a largely American phenomenon, as Israeli respondents have been less concerned about Iran than non-Israeli respondents and German respondents have been less concerned about the European sovereign debt crisis than the rest of the world.

With the U.S. elections now in the rear view mirror, U.S. respondents were no doubt at least partly influenced by the media pivoting away from the elections and toward the fiscal cliff issues – a development I analyzed yesterday in The Rise of Fiscal Cliff Concerns.

Thanks to all who have participated in these polls and have helped to generate a very interesting data set. Clearly we have a lot to learn about what drives fear and how those fears can be amplified by geography, media and proximity in time.

Related posts:

Disclosure(s): none

Monday, November 5, 2012

Fiscal Cliff Worries Grow As Election Nears

Anxiety over the outcome of the U.S. fiscal cliff topped the list of investor fears about the stock market for the third week in a row, outpolling the European sovereign debt crisis, which finished a distant second, and U.S. elections, which edged out weak earnings for third place.

With 65% of responses coming from U.S. voters, the poll results were once again skewed toward an Americentric perspective. Three weeks into this poll, it appears as if geographical and temporal proximity are having a strong effect on respondents. For third week in a row, U.S., respondents were much more concerned about events in their own country. For example, the fiscal cliff outpolled the European sovereign debt crisis by 14.8% in the U.S., while non-U.S. respondents had these two issues deadlocked in a tie for first place. Similarly, 13.9% of U.S. respondents cited U.S. elections as their top worry, while just 5.3% of non-U.S. respondents placed U.S. elections at the top of the list.

Not surprisingly, concerns about a weak earnings season fell sharply over the course of the past week, from 18.6% to 9.7%, as most of the critical earnings reports are already in the books and the potential for meaningful surprises has diminished substantially, as shown in the graphic below.

With most of the election uncertainty about to be resolved tomorrow, I anticipate that the fiscal cliff and the European sovereign debt crisis will once again separate from the pack in the next week. Whether this will place upward or downward pressure on the VIX remains to be seen.

Related posts:

Disclosure(s): none

DISCLAIMER: "VIX®" is a trademark of Chicago Board Options Exchange, Incorporated. Chicago Board Options Exchange, Incorporated is not affiliated with this website or this website's owner's or operators. CBOE assumes no responsibility for the accuracy or completeness or any other aspect of any content posted on this website by its operator or any third party. All content on this site is provided for informational and entertainment purposes only and is not intended as advice to buy or sell any securities. Stocks are difficult to trade; options are even harder. When it comes to VIX derivatives, don't fall into the trap of thinking that just because you can ride a horse, you can ride an alligator. Please do your own homework and accept full responsibility for any investment decisions you make. No content on this site can be used for commercial purposes without the prior written permission of the author. Copyright © 2007-2023 Bill Luby. All rights reserved.
 
Web Analytics