Tuesday, November 30, 2010

Impressive Launch for Sextet of New Volatility ETNs from VelocityShares

The list of tradable VIX ETNs more than doubled today, following the successful launch of six new ETNs by VelocityShares.

Last week in VelocityShares Jumping in to the VIX ETP Space with Leveraged and Inverse Products, I mapped out the new VelocityShares ETNs against existing and announced competitive offerings in the VIX-based ETP space.

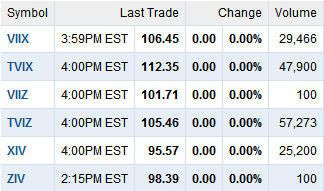
Several things struck me about today’s trading in these new issues. First, the six ETNs traded an aggregate of approximately 160,000 shares today, which is an excellent showing and indicates strong demand for volatility products, particularly when there is so much uncertainty swirling around the European sovereign debt crisis. Second, I was interested to see that the most actively traded products were the two leveraged ETNs. To my surprise TVIZ, which uses +2x leverage applied to a five month target maturity, was the volume leader (57,273 shares), edging out TVIX, which applies +2x leverage to a one month target maturity. In terms of opening day volume, the next level of interest was in the +1x (VIIX) and -1x (XIV) one month ETN, which overlap with existing Barclays products. Finally, only 100 shares were traded in the +1x (VIIZ) and -1x (ZIV) products that target a five month maturity. So, taking the liberty of jumping to conclusions based on only one day of data, investor interest in new VIX-based ETNs seems to be greatest in terms of leveraged products, then the one month maturities, with the five month maturities bringing up the rear.

Of course I expect that sophisticated investors will adjust their strategies based on the shape of the VIX futures term structure. Today the front month VIX futures closed at 2.60 points below the second month VIX futures. On the other hand, the fifth month VIX futures closed only 0.15 points below the sixth month VIX futures. To complete the daily volatility picture, today the front month and second month VIX futures rose at about twice the rate of the fifth month and six month VIX futures.

I see many opportunities here and am even toying with the idea of trading only VIX-based ETPs for the foreseeable future.

Related posts:


[graphic: Yahoo.com]

Disclosure(s): none

CVOL Steps It Up

In Citigroup Belly-Flops into the ETP Sponsor Pool, Ron Rowland had some harsh criticism for Citigroup seemingly stealth launch of the C-Tracks ETN on CVOL (CVOL) earlier this month.

I am glad to report that Citigroup now has a nifty new web site devoted to CVOL (see graphic below) that includes the prospectus, historical closing prices, a list of the factors and values that are inputs into the CVOL daily calculation (nice!) as well as a description of key risks and key terms and an attractive little charting module. In other words, Citigroup has stepped up to the plate in a big way here.

…and I’m excited that they have done so because I think CVOL has a great deal of potential. I will get into this in more detail in future posts, but essentially this ETN has chosen a much flatter part of the VIX futures term structure than VXX and is using 2x leverage to account for the fact that in the 3-4 month VIX futures maturities, volatility tends to move more gradually on a day to day basis than it does in the cash/spot VIX or in the front month VIX futures. Eventually, I think investors will warm up to this tradeoff, but until CVOL has a sufficient track record to convince some investors that in some respects CVOL has some advantages to VXX, I would expect adoption to be gradual.

So far the volume in CVOL has been low and the spreads have been very wide (often as high as 1%), but as soon as these spreads start to narrow and volume picks up, I expect to be an active trader in CVOL.

Related posts:


[graphic: Citigroup]

Disclosure(s): short VXX at time of writing

Edward Hugh and A Fistful of Euros

Ever since the European sovereign debt crisis began flaring up, I have made it a habit to read Edward Hugh’s excellent A Fistful of Euros. While The Economist and the Financial Times are two top notch resources for U.S. investors hoping to avoid an Americentric bias and incorporate a European perspective into events as they unfold across the pond, it continues to appear that ultimately the fate of the euro zone will be determined by events in Spain. Given the likely trajectory of events, I can’t think of a better time than the present to be reading what Barcelona-based economist Hugh has to say about Spain and the European financial difficulties.

For starters, check out Hugh’s last three offerings:

…then be sure to check out the archives for a comprehensive set of charts and data about the Spanish economy, more commentary, etc.

Readers, what other top European-based economics blogs should we all be reading?

Related posts:
Disclosure(s): none

Sunday, November 28, 2010

Chart of the Week: The Resurgent Consumer and Holiday Shopping

During the first half of 2010, a recovery in manufacturing helped to lift stocks. When manufacturing plateaued, stocks gave up their gains. Now it looks like manufacturing may be picking up again, but it has been consumer spending that has been responsible for much of the recent rise in equities.

There are two large ETFs devoted to retailers, XLY and XRT. While neither is a great proxy for the types of stores most likely to compete for our holiday shopping dollars, they will both pick up the major trends. I tend to have a slight preference for XRT over because XRT has more holding and these are more equally distributed. The top holding for XLY, for instance, is McDonalds (MCD).

In this week’s chart of the week below, I show the performance of XRT over the course of 2010. Note that earlier in the month XRT broke above its April high and has continued to maintain a bullish trajectory since then. Of particularly interest is the sector’s performance relative to the S&P 500 index (top study), which has been very strong since stocks began to rally in the beginning of September.

With the holiday shopping season off to a good start, XRT makes an intriguing momentum play and should be a barometer of the strength of U.S. consumer throughout the holiday season.

Related posts:


[source: StockCharts.com]

Disclosure(s): none

Wednesday, November 24, 2010

More Turkey Anyone?

It is the last week in November, so naturally all our thoughts are turning to the BCS and Turkey (TUR). Here I mean not Barclays and the bird, but the Bowl Championship Series possibilities and the emerging market.

As the chart below shows, anyone who has focused on Turkey not just as a seasonal play but a long-term holding has been nicely rewarded over the course of the past year, as Turkey has outperformed broader emerging markets ETFs like EEM by 5x. As captured in the chart, over the past month or so the performance advantage of TUR has begun to narrow. This could mean it is time to take profits and it could also spur the enterprising investor to go back for a second helping. Either way, I suggest that as 2011 approaches, investors make sure to look at emerging markets at least as a portfolio side dish, if not at a main course.

Related posts:


[source: ETFreplay.com]

Disclosure(s): long TUR at time of writing

Tuesday, November 23, 2010

Expiring Monthly November 2010 Issue Recap

A reminder that the November issue of Expiring Monthly: The Option Traders Journal was published yesterday and is available for subscribers to download.

This month’s issue has what may be my favorite feature article to date, The Volatility Risk Premium in Commodity Options, authored by Jared Woodard. If you have an interest in options on commodities, this issue has seven articles devoted to various aspects of that subject.

I have two contributions to the November issue. The first is Options Volume and Commodities ETFs, in which I discuss some of my thoughts on volume as it applies to combining market timing and options. The second piece comes from the back page column of the magazine (the same place where The Education of a Trader first appeared) and is necessarily more tangential to the options world than the other articles in the magazine. I have given this effort the title of Life Is A Call Option and will leave it at that in order to retain at least a little mystique.

I have reproduced a copy of the Table of Contents for the November issue below for those who may be interested in learning more about the magazine. Thanks to all who have already subscribed. For those who are interested in subscription information and additional details about the magazine, you can find all that and more at http://www.expiringmonthly.com/.

Related posts:


[source: Expiring Monthly]

Disclosure(s): I am one of the founders and owners of Expiring Monthly

Monday, November 22, 2010

VelocityShares Jumping in to VIX ETP Space with Leveraged and Inverse Products

Less than two weeks after I mapped out the various VIX exchange-traded products (ETNs + ETFs) in The Evolving VIX ETN Landscape, that landscape has has already changed dramatically. The first surprise was the launch of the C-Tracks ETN on CVOL (CVOL), a direct competitor to VXX, one week ago today.

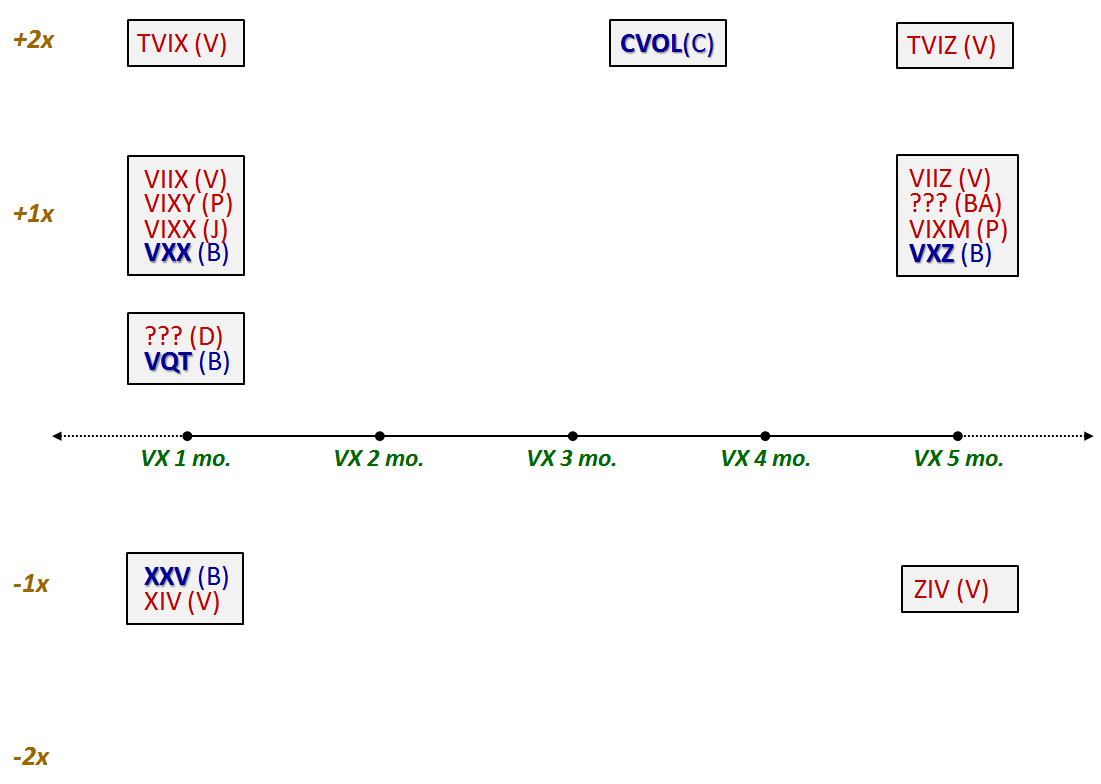
The bigger change, however, is a suite of six new VIX-based ETNs on the way from VelocityShares (see filing) to be issued by Credit Suisse (hat tip to Adam Warner, who may be de-blogging for awhile, but is still tweeting his thoughts.) In the updated VIX ETP graphic below, I have coded the new VelocityShares products with a (V) suffix. In terms of covering the existing waterfront, the new VelocityShares products include VIIX and VIIZ to compete directly with VXX and VXZ, with the inverse XIV to compete against XXV.

The innovations come in the form of new leveraged ETNs as well as a new inverse ETN which targets VIX futures with a five month maturity. In the +2x space, these are TVIX (one month target maturity) and TVIZ (five month target maturity). In the inverse space, the new entry is ZIV, which has a five month target maturity.

For volatility traders, these are exciting developments. While I have no idea what the timeframe is for the launch of the new VelocityShares products, I can already envision dozens of exciting trades...which has me wondering why I am blogging about this instead of opening up a hedge fund...

Related posts:


Disclosure(s): short VXX at time of writing

Sunday, November 21, 2010

Chart of the Week: European Stocks Holding Up Well

Six months ago the European sovereign debt crisis was flaring up and my chart of the week was the Flight-to-Safety Trade.

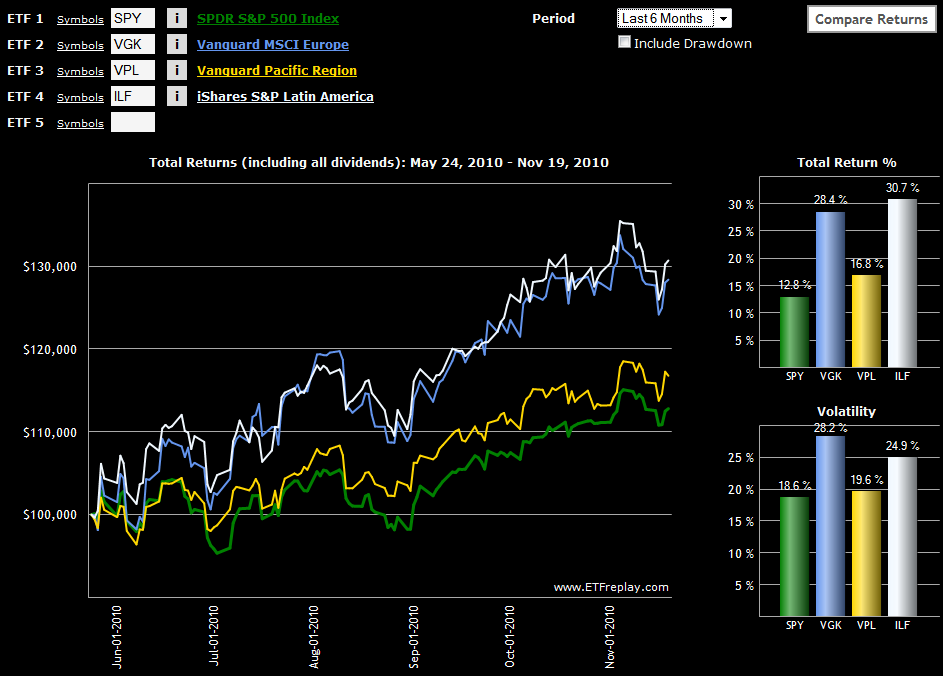
With the joint EU-IMF bailout of Ireland unfolding over the weekend and the future of Greece and Portugal in the euro zone also being called into question over the course of the past two weeks, this seems like a good time to compare the performance of Europe against some of the other continents.

While relative performance is almost always dependent upon the date one picks as a starting point, I still think many will be surprised to see in this week’s chart of the week below that at least over the course of the past six month,s Europe (VGK) has performed on par with Latin America (ILF) and has significantly outperformed Asia (VPL) and the United States. Should Europe be able to finish the year without giving up any ground to its counterpart regional ETFs, I think the continent should be allowed to exhale and declare victory, at least for 2010.

For more on related subjects, readers are encouraged to check out:


Disclosure(s): none

[source: ETFreplay.com]

Thursday, November 18, 2010

Guest Columnist for Steven Sears at Barron’s

It may just be a coincidence, but each time I have been tapped as a guest columnist for The Striking Price on behalf of Steven Sears at Barron’s, there has been a spike in volatility just as I sit down to draft some thoughts. Perhaps Steven knows something I don’t, but if he does, he’s not telling.

Today in There’s Opportunity in Uncertainty, I build on some themes from a previous September column, Will Market Volatility Return to Crisis Levels? and discuss why I think those who have been earning a nice living by selling options steadily for the past two years or so may still be able to carry that strategy forward.

In today’s column, I also mention the sentiment cycle pioneered by Justin Mamis in The Nature of Risk. As that graphic has never appeared on the blog, I have decided to include it below for reference.

I will take up some of the ideas presented in the Barron’s column, including information risk and price risk, in this space going forward.

Related posts:

Previous Barron’s contributions:

Disclosure(s): none

Wednesday, November 17, 2010

A Cluster of Support

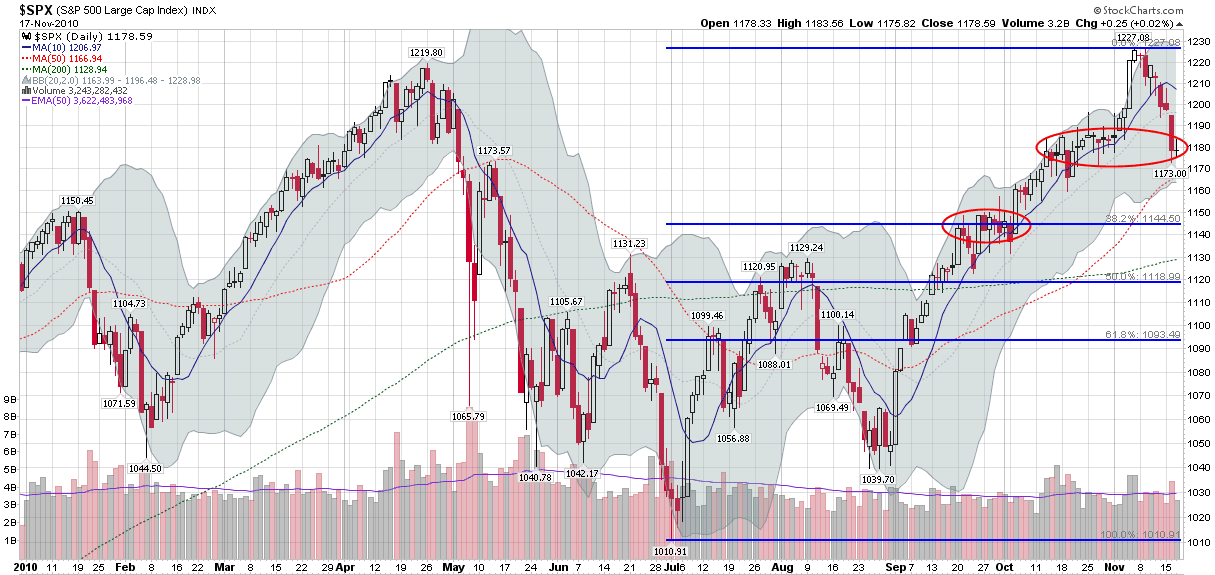
Last week in Looking for SPX Support Levels, I introduced a chart which highlighted two areas in which stocks had traded in a narrow range for about two weeks before breaking the deadlock and moving higher. I referred to these two areas as congestion areas and highlighted them in red ovals in the cart below.

The higher of the two congestion areas, which spans roughly SPX 1175-1185, represents what I consider to be the first of two tipping points. Last week I described 1175-1185 as a “line of demarcation between a minor pullback and a bearish counter trend.” So far this area of congestion has managed to muster sufficient support to halt the decline, but has yet to inspire enough buying to turn stocks back upward.

The chart below updates the two congestion areas through today’s closing data. Note that the 50-day moving average of 1167 is about to come into play as well, even as technical factors take a back seat to issues in Europe and China.

Related posts:


[source: StockCharts.com]

Disclosure(s): none

Tuesday, November 16, 2010

VIX Punches Through Upper Bollinger Band

The VIX has no idea what is going on in Ireland and has no way of knowing whether the markets are underestimating or overestimating the full extent of the European sovereign debt crisis, not only in the Emerald Isle, but also in Greece and Portugal.

While it is always important to be well-informed when it comes global political and economic flash points, most VIX traders prefer to take a technically-based approach to trading volatility. In this vein, the simplest and most effective approach is to fade any VIX extremes. I have covered many ways to measure VIX extremes in this blog. One of the simplest is to use Bollinger bands to identify VIX values which are extreme enough to invite high probability mean reversion trades.

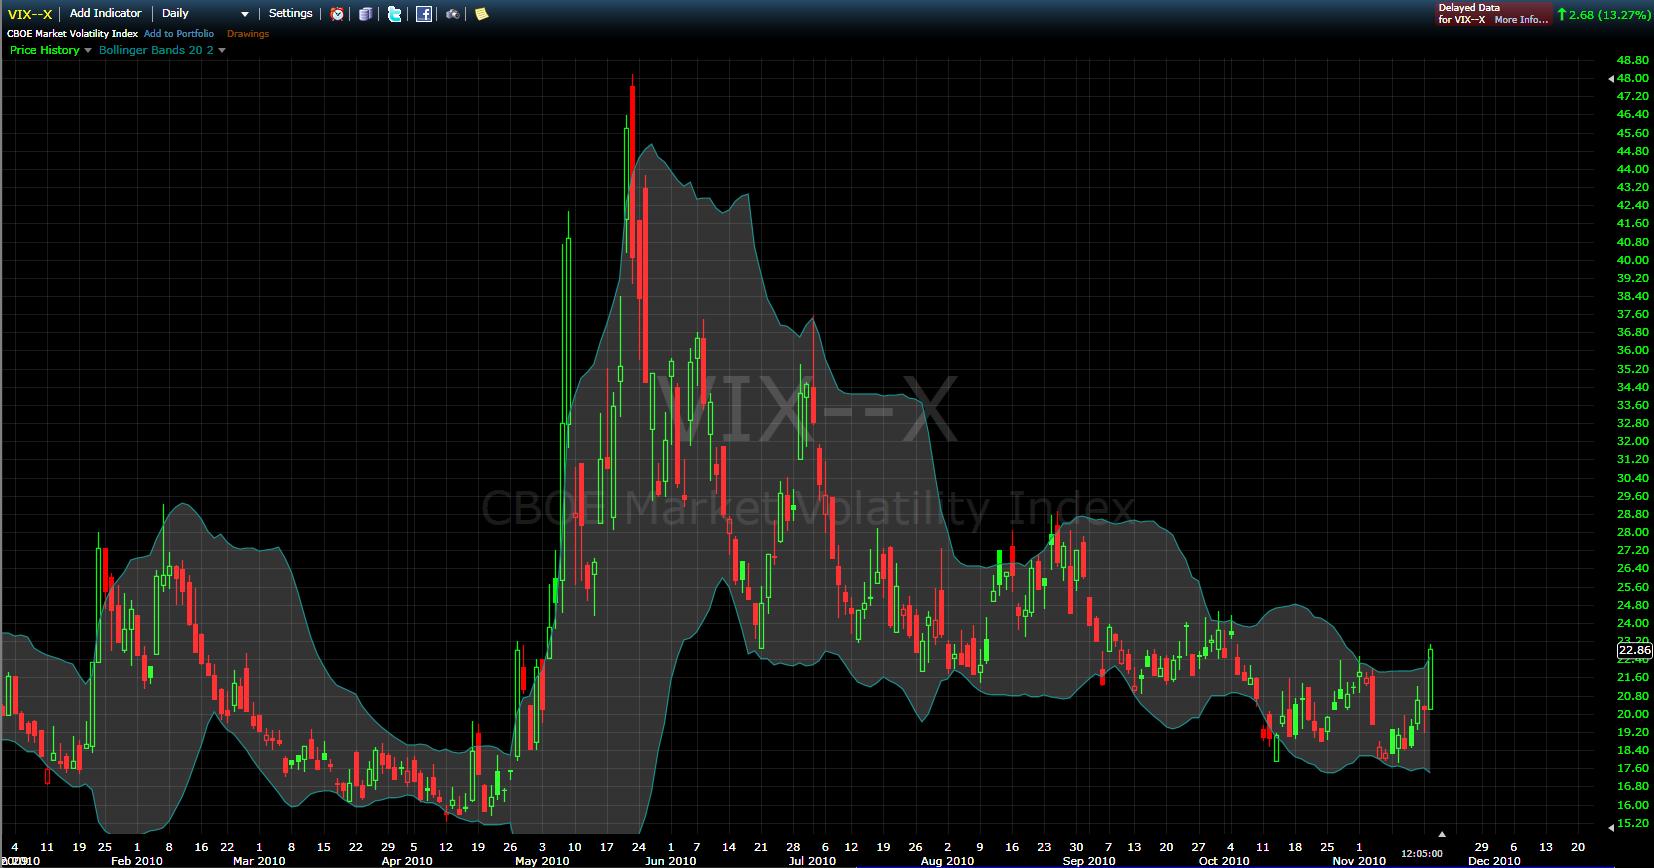
The chart below is a daily bar snapshot of the VIX, with standard Bollinger band settings (20 days, 2.0 standard deviations), showing that the recent VIX high of 23.06 is well above the 22.45 upper band level of the current Bollinger band settings. For most VIX traders, this means a short VIX play is in order, irrespective of events on the ground in Europe.

For those who are new to volatility trading, keep in mind that VIX spikes have a habit of clustering and creating a vicious cycle. One only has to scroll back six months to see what happened the last time concern about European sovereign debt soared, sending the VIX from 15 to 48 in the space of a month.

Related posts:


[source: FreeStockCharts.com]

Disclosure(s): short VIX at time of writing

Monday, November 15, 2010

CVOL Begins Trading Today

Today the first non-Barclays volatility ETN began trading (CVOL), whose formal name is (and I am not making this up) “C-Tracks Exchange Traded Notes Based on the Performance of the Citi Volatility Index Total Return.” Fortunately, what I will be affectionately calling CVOL also has a formal short name of “C-Tracks ETN on CVOL” so that if anyone happens to ask you what CVOL stands for at a cocktail party, at least you can blurt out the answer in one breath.

Going forward, the big question is how CVOL and its 3-4 month VIX futures target maturity and 2x leverage component will perform relative to the Barclays competition: VXX and VXZ.

CVOL will need some more volume and liquidity before we can make some meaningful comparisons, but with 3900 shares traded today, at least some investors are already stepping up to the plate.

The links below provide some additional information about CVOL and attempt to locate it in the VIX ETN universe.

Related posts:

Disclosure(s): short VXX at time of writing

Sunday, November 14, 2010

Chart of the Week: Uptick in the Jobs Picture

Lost in all of the attention paid to Ireland, China, Cisco (CSCO) and the week’s other headline grabbers was some signs of progress on the jobs front, specifically in the area of the weekly jobless claims data.

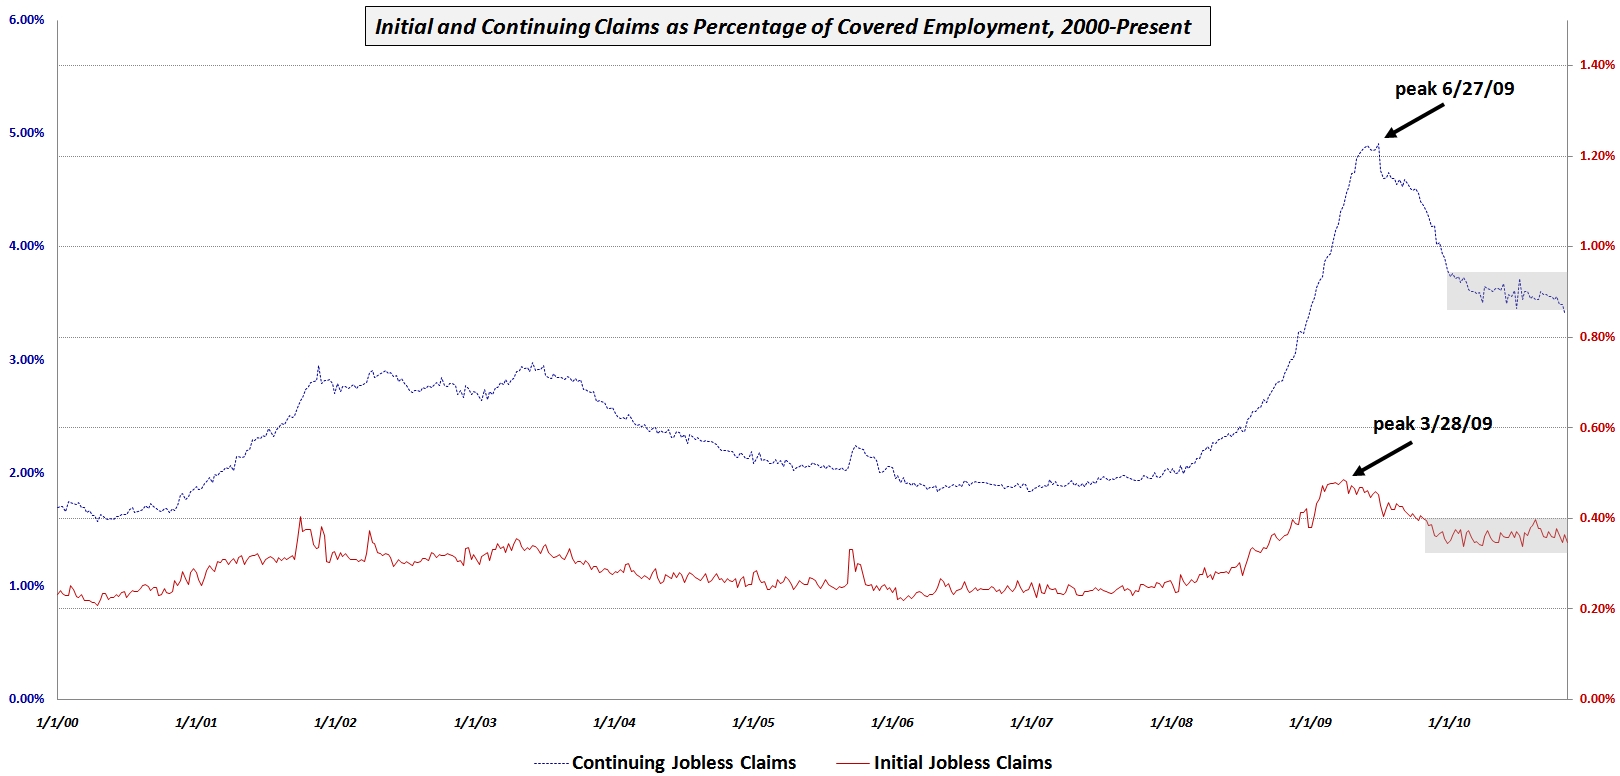
This week’s chart of the week shows initial and continuing jobless claims since 2000 as a percentage of total covered employment in order to adjust for the changing size of the workforce. Note that while initial claims (solid red line) peaked first in March 2009, they have been in a holding period for the last year or so. Continuing claims (dotted blue line) peaked three months later and initially showed a sharper decline. While continuing claims began to form a plateau earlier in the year, the last month or so has seen noticeable improvement, with the trend line now dropping below the gray rectangle which marks the recent consolidation area.

This improvement could be a precursor to some downward movement in the unemployment rate, which may show up as early as in this month’s data.

Related posts:


[source: Bureau of Labor Statistics]

Disclosure(s): none

Thursday, November 11, 2010

The Evolving VIX ETN Landscape

As of today, only four VIX exchange-traded products (ETNs and ETFs) are available for trading. All of these have been Barclays products and three of the four carry the iPath brand name. In descending order of volume, the VIX-based ETNs currently being traded are:

  • iPath S&P 500 VIX Short-Term Futures ETN (VXX)
  • iPath S&P 500 VIX Mid-Term Futures ETN (VXZ)
  • iPath Inverse S&P 500 VIX Short-Term Futures ETN (XXV)
  • Barclays ETN+ S&P VEQTOR ETN (VQT)
Five other companies (ProShares, Direxion, Citigroup, Jefferies and Bank of America) have VIX-based ETNs and ETFs (in the case of ProShares) in registration or have made announcements about forthcoming products, but I am unaware of any target launch dates.  In order to simplify matters a little, henceforth I will start to refer to these products as exchange-traded products or ETPs.

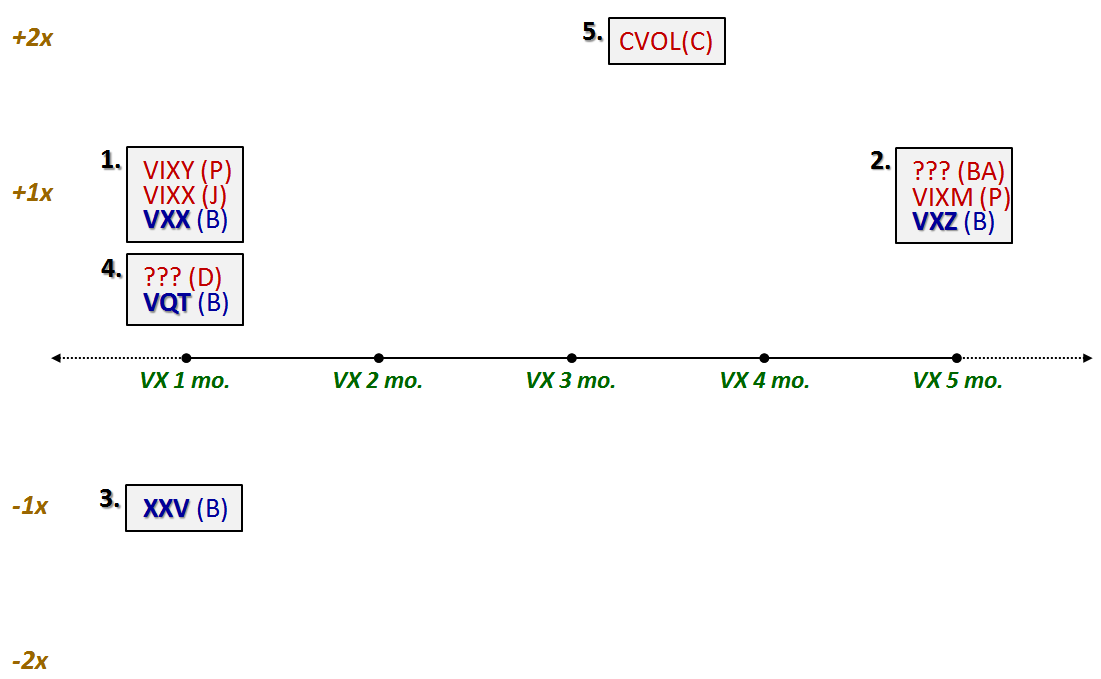
In order to attempt to simplify and catalog the growing universe of available and announced VIX-based ETPs, I have assembled the chart below. The chart uses the y-axis to plot the leverage used (all are standard +1x ETPs, with the exception of the +2x CVOL and the sole inverse product, the -1x XXV) and the x-axis to plot the target maturity. VX 1 mo. is short for VIX futures with a constant maturity of one month, etc.

I have identified each ETP by its ticker (I do not yet have tickers for the Direxion or Bank of America products) and have coded these with a one or two letter suffix to identify the issuer (P for ProShares, D for Direxion, C for Citigroup, J for Jefferies and BA for Bank of America.) ETPs that are currently traded are in bold blue; ETPs that have not yet been launched are in red font.

The final piece of information involves grouping the ETPs into five clusters which represent the five approaches currently being used for VIX-based ETPs. For all intents and purposes, the ETPs in each cluster are (or appear to be, at this juncture) equivalent in construction and should behave in a similar manner. Group #1 for instance, has been the dominant theme in the volatility ETP space to date. The focus here is on VIX futures with a constant maturity of 30 days. VXX was the first to market, but competitive offerings from Jefferies and ProShares are on the way. Group #2 uses a similar approach, but with a 5-month target maturity. Group #3 is the inverse of Group #1.

Group #4 represents what I consider to be a second generation of products, with a dynamic allocation of 2.5% to 40% (see Barclays VEQTOR ETN Begins Trading for details), which is why the group is shown here as having less than +1x leverage.

The newest VIX ETP approach comes from Citigroup, where their CVOL product not only targets a new portion of the VIX futures term structure (3-4 months), but adds a +2x leverage component and also includes a “variable weighted short position in the S&P 500 Total Return Index” as well.

Things continue to get more and more interesting in the VIX ETP space. I look forward to the launch of some of these newer products and to seeing how they perform.

It should go without saying that as the VIX ETP landscape continues to evolve, I will do my best to attempt to map it in a meaningful manner.

Related posts:


Disclosure(s): none

Wednesday, November 10, 2010

Measuring the Pullback

One hour into today’s session finds the S&P 500 index hovering just a few points above the 1200 level as weakness which began on Monday and accelerated yesterday has continued into the early stages of today.

Yesterday, in Looking for SPX Support Levels, I offered up a chartists’ perspective on how far the current pullback might extend. Today I am updating a table which has captured what I consider to be all the significant pullbacks since stocks bottomed in March 2009.

At only 1.9% peak to trough, the current pullback is not yet as significant as any of the previous dozen pullbacks. Using the table as a measuring stick, if the current selloff is able to muster enough bearish momentum to match the group mean, this would take the SPX all the way back to 1151.

Related posts:


Disclosure(s): none

DISCLAIMER: "VIX®" is a trademark of Chicago Board Options Exchange, Incorporated. Chicago Board Options Exchange, Incorporated is not affiliated with this website or this website's owner's or operators. CBOE assumes no responsibility for the accuracy or completeness or any other aspect of any content posted on this website by its operator or any third party. All content on this site is provided for informational and entertainment purposes only and is not intended as advice to buy or sell any securities. Stocks are difficult to trade; options are even harder. When it comes to VIX derivatives, don't fall into the trap of thinking that just because you can ride a horse, you can ride an alligator. Please do your own homework and accept full responsibility for any investment decisions you make. No content on this site can be used for commercial purposes without the prior written permission of the author. Copyright © 2007-2023 Bill Luby. All rights reserved.
 
Web Analytics