Thursday, June 28, 2007

Thanks to All

Thank you to all who weighed in on my mother’s passing. It is comforting to know that people who I have never met, who live on several continents, and who pray in many different languages all have my family in their thoughts.

A special mention for Trading Goddess: keep those postcards coming and let your heart be your guide.

It may just be a coincidence, but it seems as if whenever family matters pull me away from the blog, the VIX, like an unsupervised child, starts acting up. It started on my birthday, February 27th, and has carried over to this week. Since I have been largely tuned out of the markets for most of the recent action, this seems like a good time to highlight the work of some of my favorite bloggers who have been talking up the VIX in the last day or two:

I will probably be back posting on a regular basis again next week. In the meantime, be sure to hug someone special and let them know you much you love them.

Wednesday, June 27, 2007

For My Mother

My mother, Ann Luby, passed away yesterday after a long bout with leukemia.

Over the years I have learned many things from her and I have a wealth of memories to cherish, but her absence will leave a large void in my life. Needless to say, I love her and will miss her dearly.

When she was just out of college, my mother took a job teaching high school math in an inner city school in Hartford, Connecticut. She particularly enjoyed teaching those who struggled most with math and delighted in making math fun for them by translating difficult concepts into games and real life applications.

I could not have been more than eight years old when she presented me with a slide rule and helped me to understand that numbers were more than just tables to be memorized, but concepts and relationships that reduced much of the complexity of the world to simple truths. I didn’t know what a Monte Carlo simulation was back then, but after she taught me how to calculate batting averages and ERAs, I grabbed some dice and lots of paper and created dice baseball leagues, internalizing probabilities and distributions along the way so that it became effortless for me to create mock baseball leagues, teams, games and players whose various stats were just as real in statistical terms as those logged in Fenway Park and Yankee Stadium. Needless to say, when the rest of my class finally got around to long division a couple of years later, I just smiled and nodded my head.

Though she remained a teacher of one sort or another all her life, my mother always wanted to be a journalist more than anything else. When her career veered in a journalistic direction, I was there to cheer her on and learn everything I could about the process of gathering information, analyzing it, formulating ideas, and presenting them in a persuasive manner.

Only in the last day or two have I come to realize that not only do I find myself pursuing some of the same disciplines that were close to her heart, but in many ways the expression of my ideas here in this blog are the offspring of her life’s work as well.

The passing of the baton from one generation to the next does not always go as smoothly as some might have hoped. In this case, I could not have been better prepared. Thank you, Mom, for being a great teacher and for everything you have done for me.

Finally, no matter how near or how far she traveled, my mother always sent me a postcard. Mom, this one is for you.

Tuesday, June 26, 2007

The Language of the SPX:VIX Ratio

A fellow blogger at The dk Report inquired about the analytical value of the SPX:VIX ratio and what it may be telling us at present.

The simple answer is that I don’t know…but I’ll see if I can articulate my uncertainty a little more eloquently in the space below.

Taking a step back, the reason I first even bothered to mention the SPX:VIX ratio on this blog was to address some comments by Ron Sen at Technically Speaking, who blogs about the SPX:VIX ratio on a regular basis and asked rhetorically back on February 19th if this ratio was an effective risk metric. My rejoinder was that it does not make sense to compare a trending number like the SPX with an oscillating number like the VIX. Given that the long-term gains in the SPX approximate 10% per year, I somewhat flippantly suggested that a 10% trend line might be added to this ratio. Having tossed this idea out, I proceeded to look for some insight using the distance between the ratio and the trend line in the wake of February 27th and again when the markets seem to have settled down a month later.

Regarding the 10% trend line, however, I would be remiss in pointing out that my choice of the 10% value was relatively arbitrary (though supported by Ibbotson data) as was my selection of a starting point for the trend line, which turned out to be the default setting for a StockCharts.com monthly chart I created at that time. I used September/October 1991 as a starting point; if you use a different starting month, you can come up with a substantially different trend line.

While keeping one eye on the SPX:VIX ratio, in the last several months, I have spent more of my time and energy researching various correlations between the SPX and the VIX – and will present some findings and interpretations on this subject in the near future. I have already posted about one finding: that when the SPX and VIX are highly positively correlated for short periods of time, this does not augur well for the markets.

High on the priority list for my one man R&D department is to develop a model for long-term volatility forecasts. The VWSI and mean reversion analysis that I have relied heavily upon to this point is best suited for a 5-10 trading day time horizon, though they are sufficiently robust to be applied out to about 20 trading days. It is possible that an analysis similar to that of the SPX:VIX plus a 10% trend line might be appropriate for long-term volatility forecasting, but this remains to be seen. I will also look to tweak the VWSI in order to enhance its predictive power going out 1-3 months. I consider the VWSI and mean reversion to be excellent tools for trading during the current options cycle, but in terms of volatility, I think the Holy Grail lies in being able to look out a quarter or two. This will certainly be an area I look at closely going forward. As always, I encourage reader input.

Monday, June 25, 2007

Today's Key Number for the VIX is 17.26

At 17.26, the VWSI model jumps from -5 to -7 and I will likely open a fairly significant short position in the VIX. Keep in mind that because fear and greed can go vertical in a hurry, it is always a good idea to scale into a VIX position, starting with a small opening position, and adding to it when the odds in your favor get better. If the VIX continues to spike to 20 or 25, for example, you want to make sure you have some dry gunpowder to take advantage of it.

FWIW, I have already opened up a small short position with call spreads, but I may quickly switch from call spreads to puts if volatility continues to rise. It is unusual that the VWSI threshold targets for today are so compressed, with a VWSI of -10 hit at 17.43. If we get that far, I'll probably be buying some ATM puts, then if things get uglier, perhaps some OTM puts.

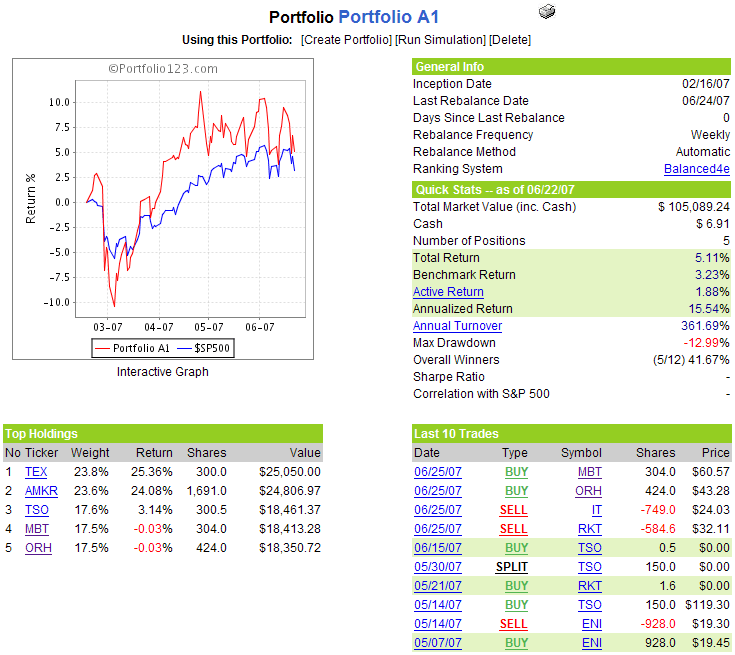
Portfolio A1 Adds ORH and MBT; Drops IT and RKT

After a dreadful week that saw Gartner (IT) stock give up 10%, I was not surprised to see the company dropped from the Portfolio A1 holdings. On the other hand, I was surprised to see Rock-Tenn (RKT) dropped as well.

It turns out that the sale of IT was triggered by a significant drop in my stock ranking system, which was largely due to technical weakness. Even with last week’s disaster, we are still able to book a 6.5% profit in the stock over the course of our three month holding period. For RKT, the stock continues to be ranked very high in my stock ranking system, but it is sold because it has now dropped 20% from the post-purchase high, which automatically triggers a selling rule, one that kicks in now that RKT's gains have slipped to 2.8%.

By way of explanation, the 20% rule is designed to get me out of high fliers that may now be in the early stages of a large pullback; during a downturn, it will often also shift the portfolio from high beta stocks to more defensive holdings.

On that theme, I welcome Odyssey Re Holdings (ORH) a reinsurance company, to the portfolio, along with Mobile TeleSystems OJSC (MBT), an ADR for the Moscow-based cellular company.

There are no other changes to the portfolio for the coming week.

A snapshot of the portfolio is as follows:

Sunday, June 24, 2007

All that Volatility and VWSI *Still* at Zero

I must admit that I was a little surprised to discover that the VWSI ended the week at zero once again, given all the volatility on Wednesday and Friday and a 13% gain in volatility for the full week, with the VIX jumping from 13.94 to 15.75.

Just to see if that 13% jump in the VIX and a corresponding VWSI of zero was unusual, I looked back for recent VIX weekly moves of 13%. Sure enough, the last two times the VIX ended the week up 13% (the weeks ended 3/30/2007 and 12/22/06), the VWSI also ended up at zero. Key takeaway: a 13% weekly jump in the VIX apparently tends not to move the needle on the VWSI and does not necessarily have any significance in terms of mean reversion trading opportunities and near-term VIX forecasts.

For comparative purposes, when the VIX jumped 16% two weeks ago, it only triggered a VWSI reading of -1; and a 19% jump for the week ended March 16, 2007 only moved the VWSI to a -2 reading.

When it comes to volatility predictions, about the only thing I feel comfortable predicting right now is that the next sub-10 VIX reading is likely a long way away.

(Note that in the above temperature gauge, the "bullish" and "bearish" labels apply to the VIX, not to the broader markets, which are usually negatively correlated with the VIX.)

Wine pairing: For an inexpensive Rhone blend, I continue to recommend: Oakley Five Reds; Robert Hall’s Rhone de Robles and Tablas Creek’s Cote de Tablas Blanc; Wrongo Dongo, the contrarian favorite from Spain; and The Stump Jump (I prefer the white over the red) from Australia. If you are looking for additional ideas, I encourage you check out the Rhone Rangers.

Friday, June 22, 2007

Put to Call Ratios for Individual Stocks

Today the CXO Advisory Blog is out with an assessment of the predictive value of put to call ratios for individual stocks. Drawing heavily on Jun Pan and Allen Poteshman’s 2006 “The Information in Option Volume for Future Stock Prices” from The Review of Financial Studies, the folks at CXO conclude that put to call ratios have “significant predictive power for individual stocks.” Unfortunately, there is a qualifier that “this effect relates predominantly to data that is not publicly available.” [underline in original]

While I support these conclusions, I would not be so quick to be deterred by the qualifier. In “How to Find the Earnings Spiker Before the Announcement” I highlighted the put to call ratio for individual stocks as a key component of the screening formula and provided a link to the SchaeffersResearch.com page where you can find the appropriate charts and data. This data is both public and free; you can’t beat that.

There is also a subscription service from the ISE called ISEE Select that the exchange describes as a “trading tool that uses proprietary call/put trade data from the ISE to identify bullish and bearish sentiment for individual securities.” The ISE goes on to explain that ISEE Select “allows subscribers to retrieve intraday and historical call/put values for securities whose options are traded on ISE.” For the record, I intend to give ISEE Select a try shortly and will be glad to provide my thoughts about the value of this service in this space. In the interim, interested parties may want to check out ISEE Select services and pricing, as well as their FAQs.

Thursday, June 21, 2007

My Contrails; Your Entrails

When I was first dating my wife, I looked up in the sky and make a comment about a series of wavy ‘entrails’ that were spicing up our sunset. I know the difference, of course, but once the damage was done, there was no ‘undo key’ to restore my dignity. I think I can still hear her laughter.

In any event, I eventually got over the embarrassment and she married me anyway, so it really shouldn’t matter…but since today is a full day of travel that will probably leave me out of pocket for almost 24 hours, I figured that while I’m leaving contrails, readers could benefit from the following linked entrails to better position themselves to profit from whatever the future brings:

Wednesday, June 20, 2007

VIX Implied Volatility at a 52 Week Low

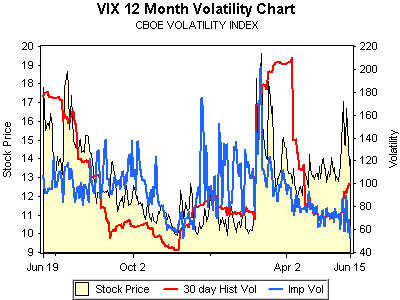
There is always a risk of trying to cram too much information into one graphic, but with the image to the right, I figured it was worth a try.

The chart, which comes courtesy of optionsXpress, depicts implied and historical volatility in VIX options over the past year, in addition to the VIX price, which is part of the reason why it is messier than the (more elegant and readable) iVolatility VIX options chart that shows only implied and historical volatility.

The reason I bother mentioning any of this is that VIX call options closed yesterday with their lowest implied volatility reading of the past 52 weeks. So if you think the market is getting toppy, but you are reluctant to go long the VIX because it is still a fair distance from single digits, consider that the volatility premium for VIX calls is as cheap as it has been in a long time.

Tuesday, June 19, 2007

Should Bulls Root for a High VIX or a Low VIX?

About two months ago, several readers asked me if I thought the markets could continue to make new highs while the VIX hovered significantly above its all-time low. My answer then, an enthusiastic “Absolutely!” has not wavered. In the interim, I have even managed to accumulate two additional months of data to support my case.

Today Bernie Schaeffer is talking up the same theme, this time with a piece bearing the lengthy title of “An Elevated VIX Points to Continued Gains: Why the Rising CBOE Market Volatility Index (VIX) Signals Less Complacency.” With titles like that, it hardly seems worth the trouble to read the few extra words in the body of the article that didn’t make it into the title, so I will save you the effort by highlighting his main points:
“The ratcheting up of the low end of the CBOE Market Volatility range from single digits to the floor in the 12-12.50 zone that has prevailed since March is, in my opinion, a major positive for the sustainability of this bull market.
The fact that premium sellers are demanding more for assuming risk is a direct refutation of the "complacency" argument those looking to call a top are so fond of trotting out. And to the extent there is less premium selling activity, the "speed bumps" that are created at strikes with large open interest that can often slow rallies to a crawl are mitigated.”

In short, Schaeffer and I are pretty much on the same page here in thinking that an elevated VIX floor is a contrarian bullish signal for the markets.

The one point of contrast I do want to emphasize is in the chart Schaeffer uses to support his contention that a high VIX is a bullish signal for the markets. In his SPX and VIX chart, Schaeffer displays the classic pattern of VIX spikes almost perfectly correlated with short to intermediate-term bottoms in the SPX. While I take no issue at all with the 10 to 20 day mean reverting characteristics of the VIX that I probably discuss here too often, the point I want to re-emphasize is that the long-term correlation patterns between the SPX and the VIX are a lot more problematic. If you look at a monthly VIX chart I posted awhile back, you can see extended periods of time where the SPX and VIX are negatively correlated (2003-2007) and others where they are positively correlated (1995-1999.)

The bottom line is that it is important to keep in mind that the shorter the time-frame, the more likely the SPX and VIX are to be negatively correlated. In the short-term, therefore, bulls should be adding to their positions when the VIX spikes; over the longer term, however, I would not be surprised to see both the SPX and the VIX to be moving higher in tandem.

Monday, June 18, 2007

The Risk Library

Two weeks ago I offered up “Ten Anecdotal/Historical Book Ideas for Investors” on the premise that humans have a tendency to learn and retain more valuable concepts when the learning process is enjoyable.

This list is quite different. Risk is something that the novice trader/investor invariably fails to think about enough and properly address in their trading methodology. Interestingly, risk management is often the Achilles heel of more experienced traders who know better, but also fail to attend to with sufficient rigor.

With this in mind, I offer up some favorites from my personal library to help all traders think about risk and act to limit the risks inherent in their trading strategies, ordered roughly from the most abstract to the most prescriptive, which I often find is an excellent way to tackle any unfamiliar subject:

Against the Gods (Peter Bernstein) – A high level survey of the history of risk from the perspective of the advance of civilization. A relatively quick read that should inspire the desire to take a closer look at risk vis-Ă -vis investments. 

The (Mis)Behavior of Markets (Benoit Mandelbrot) – A fun and mind-expanding stew of financial risk, fractals and chaos theory. A great thought starter and surprisingly easy for non-math/physics scholars to breeze through.

Fooled By Randomness (Nassim Taleb) and The Black Swan (Nassim Taleb) – I suggest you try these in chronological order, starting with Fooled By Randomness. If Bernstein and Mandelbrot offer up two solid thought starters, then Taleb is a master of throwing gasoline on the fire. Deftly written in his own idiosyncratic narrative, Taleb’s books are bursting at the seams with ideas and ground zero is risk.

Choices, Values, and Frames (Daniel Kahneman and Amos Tversky) – Behavioral finance is a subject that is still gaining traction, but the sooner you steep your thinking in the ideas of the discipline’s founding fathers, Kahneman and Tversky, the better off you will be. This particular book is a collection of essays that you can read through at your own pace.

Manias, Panics, and Crashes (Charles Kindelberger) and/or Devil Take the Hindmost (Edward Chancellor) – Kindleberger offers a dense but informative history, while Chancellor wins out in terms of readability. Each is an excellent account of the history of speculation and market excesses; picking one of the two would probably suffice. Note that Charles MacKay’s Extraordinary Popular Delusions and the Madness of Crowds should also probably be on this historical menu, but I have not yet read it.

With Fortune’s Formula (William Poundstone), this list passes over from the largely theoretical into the prescriptive realm. This is a fun read on the Kelly criterion, set to a backdrop of blackjack and casino gambling.

A Thousand Barrels a Second (Peter Tertzakian) and/or The Oil Factor (Stephen Leeb) – There are many books out there that discuss the merits of Peak Oil. I have only read a few of them, but Tertzakian’s treatment is by far my favorite and certainly one of the more objective ones. Leeb’s book probably created a larger stir (as did his The Coming Economic Collapse, which strikes me as little more than a hastily assembled slight update of his previous book), but it covers most of the important points in much smaller bites. Every investor, Peak Oil proponent or otherwise, needs to take a close look at this subject and be prepared for how a number of oil-related scenarios may play out over the remainder of their investment time horizon.

Financial Shenanigans (Howard Schilit) – The subtitle of the book, How to Detect Accounting Gimmicks & Fraud in Financial Reports is exactly what this book is all about. Here is a fundamental approach that addresses what to look for, with an excellent treatment by Schilit. It is up to the reader to determine whether these companies should merely be avoided or whether they might also be short candidates.

How to Make Money Selling Stocks Short (William O’Neil and Gil Morales) – This is another prescriptive book and it relies entirely on a couple of basic technical analysis concepts. Even with that shortcoming, I think the true value of the book is that it will help you to actively look for short opportunities and avoid the confirmation bias that long-only approaches can sometimes succumb to. For example, if stock chart is screaming “buy” at you, would it be a “sell” if you turned the chart upside down?

When to Sell (Justin Mamis) and/or It’s When You Sell that Counts (Donald Cassidy) – While it is easy to find books on how to buy stocks, good luck finding an entire book devoted to the topic of selling them. Mamis and Cassidy are the only two books of this kind I have encountered and fortunately each offers an excellent treatment of the subject. I am slightly partial to Mamis here, but since most of us make or lose a lot more money managing existing positions than seeking better entries, my suggestion is to try both of them.

Trading Risk (Kenneth Grant) – This book is the only one I know of that offers highly detailed advice about how to evaluate the various types of risk in your holdings and take action to mitigate those risks. If I could, I would make it required reading for any newcomer to the investment world.

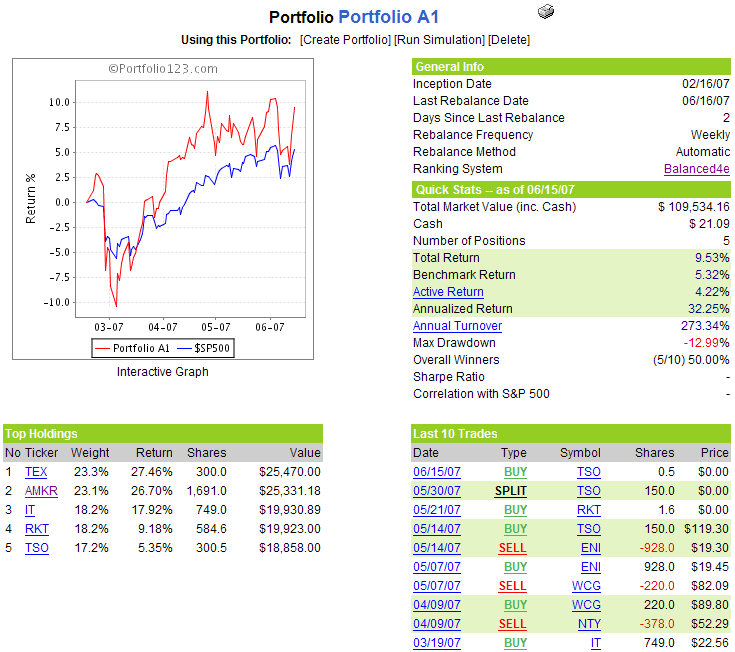
Portfolio A1 Seeing All Green

On the heels of last week’s lackluster performance, the portfolio roared to life this week, with all five of Portfolio A1’s holdings logging weekly gains. This enabled Portfolio A1 to stretch its performance margin over the benchmark S&P 500 from 1.7% to the current 4.2%.

Note that Tesoro (TSO) paid out a dividend of $0.10 on Friday. In keeping with the precedent established with the treatment of an earlier Rock-Tenn (RKT) dividend, I am automatically reinvesting the cash proceeds into the appropriate stock.

Once again, there are no changes to the portfolio for the coming week.

A snapshot of the portfolio is as follows:

Sunday, June 17, 2007

All Quiet on the VWSI Front

After two weeks of head fakes, the VWSI has settled back to an even zero reading, apparently less impressed by this week’s 16.67 high than the 17.09 peak reading from the previous week.

For those who may not have been following the VWSI here since its mid-February inception, I use this indicator to help predict the price of the VIX in the coming week. The good news is that the VWSI also has a solid track record of predicting the VIX 2-4 weeks out, though as with most crystal balls, with each week into the future it is applied, the margin of error increases substantially.

I mention all this because in the last couple of days, I have been going back and forth with Adam Warner at Daily Options Report about the likelihood of seeing a sub-10 VIX during the new options cycle that ends on July 20th. I posted a summary of our respective thinking on Friday and bring it up again here because I am fairly certain that you will not find anyone else who is making public predictions about where the VIX will be 25 trading days out. Hell, I thought I was going out on a limb just using the VWSI to look out 5 days…

(Note that in the above temperature gauge, the "bullish" and "bearish" labels apply to the VIX, not to the broader markets, which are usually negatively correlated with the VIX.)

Wine pairing: For an inexpensive Rhone blend, I recommend: Oakley Five Reds; Robert Hall’s Rhone de Robles and Tablas Creek’s Cote de Tablas Blanc; Wrongo Dongo, the contrarian favorite from Spain; and The Stump Jump (I prefer the white over the red) from Australia. If you are looking for additional ideas, I encourage you check out the Rhone Rangers.

Friday, June 15, 2007

No Grunting, Please

Yesterday I spelled out my position on the unlikely return of a sub-10 VIX. Of course, the first thing I noticed when the markets opened today was that the VIX had fallen another 1.06 points to 12.58, meaning that a single digit VIX was suddenly not looking like a fanciful idea. I haven’t changed my opinion about the VIX trading in the 12.50 – 15.00 range, but I must confess to elevating an eyebrow for some of the morning’s action.
Frankly, I never anticipated that my drop shot back over the net to the Daily Options Report would be returned, but the fleet afoot Adam Warner pounced before you could say “VIX implosion” and detailed his thinking about how gravity might swallow the VIX whole during the next options cycle.

I recommend that you get the benefit of his thinking in its entirety, but for those who are on a strict mouse click quota, I have highlighted some of the salient points:

“Let's consider July options. They have 35 days until expiration. But I would strongly suggest this is not a typical 35 day stretch. Summer is slower to begin with, and have a holiday smack in the middle of this cycle. On a Wednesday no less, which invariably leads to an incredibly dull week.

If you net-buy options of any sort, you are buying time and the typical market action that the price implies. But you are not getting full time value here, rather something les than 35 days worth of fluctuation.

So as such, buyers are going to lower their bids.

Likewise sellers know they have less risk than in 35 normal days. Barring an *event*, there is a ton of dead time coming up. So they can offer cheaper.

Now back to the volatility calculation. It picks up NONE of this. As the price of an option gets cheaper and everything else stays the same (most notably time until expiration), it will spit out a lower volatility.

And to me we have a perfect storm brewing. The early parts of an expiration cycle generally produce lower volatility anyway as buy writes get rolled. Then comes the holiday, and not just a long weekend but a week long siesta.

Throw in the fact that summer is starting, and options are already on the high side relative to actual stock volatility and it just feels VERY vulnerable to a VIX crush.”

Mind you, I would hope that readers will not let their own feelings about whether Maria Sharapova or Ana Ivanovic is the better tennis player or more pixel-worthy influence your thinking about the VIX, but if teenage boys start flocking to this site to brush up on their market timing skills, at least I know that I will have contributed to the betterment of humanity in some small way.

Charting the VIX with 10 Day SMA Envelopes

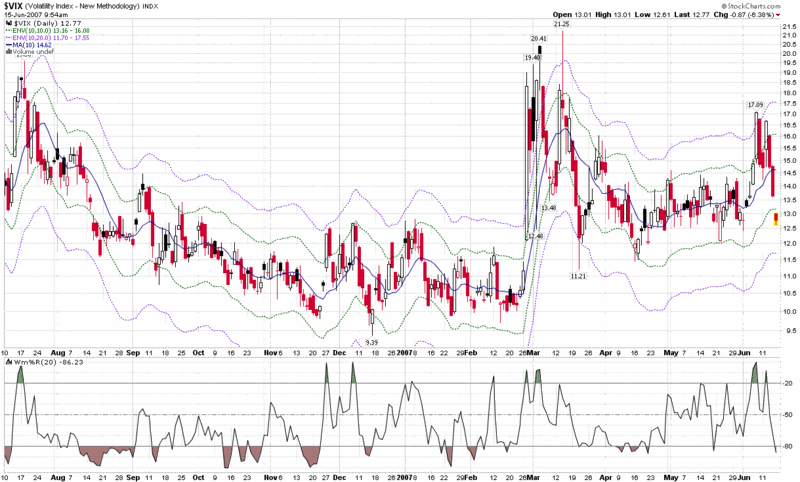
While the VIX is currently in the process of what looks like a mini-implosion, I thought this might be a good time to offer up what may be the best single chart for keeping track of the VIX.

To understand where I am coming from, I should say up front that I consider the 10 and 20 day simple moving average to be two of the most important pieces of VIX data to watch – and the keystone for short-term mean reversion analysis. Of these two SMAs, I favor the 10 day SMA slightly over its older sibling.

Of course you can easily put the 10 day SMA and the 20 day SMA on the same chart, but what is often more useful is to know just how far the VIX has strayed from these moving averages. For a quick visual check of this, I recommend using moving average envelopes, such as the ones shown in the chart below. You can follow the link in the previous sentence to see how StockCharts describes these envelopes or just consider that they work in a similar fashion to Bollinger Bands, except that instead of using standard deviations as a measuring device for the width of the bands above and below a mean, the moving average envelopes used a fixed percentage of the simple moving average.

An example helps tell the story. In the chart below, the 10 day SMA (mean) is represented by a solid blue line, with a current value of 14.62. The 10% upper band (currently 16.08) is represented by green dotted line while the upper 20% band (currently 17.55) is shown with a purple dotted line. A similar pattern is evident in the lower bands.

There are a couple of important things to remember about moving average envelopes. First, unlike Bollinger Bands or any other standard deviation-based calculation, they do not reflect any sort of volatility. Instead, their width is entirely a function of the value of the underlying SMA, regardless of volatility. Second, the 20% bands are rarely violated and usually represent excellent mean reversion setups; the 10% bands are violated more frequently, yet also offer many good mean reversion setups.

While there are many ways to watch and analyze the VIX, in my opinion moving average envelopes are among the best tools out there for the chartist trader.

Thursday, June 14, 2007

VIX Implosion Ahead?

Let me start off by saying that I would probably mention Adam Warner and his Daily Options Report more often on this blog, but in doing so I risk the possibility of engaging in an extended baseline VIX rally – and that might put everyone to sleep.

In his usually provocative manner, today Adam is talking about the possibility of a VIX implosion that might send the volatility index back into single digits.

I have chronicled the history of sub-10 VIX closes here in the past, but since February 27th, that subject has fallen off of my radar. First, I’ll start with some historical context. Adam mentions the possibility of the VIX imploding during the next options cycle. At current levels, a one month drop of about 30% would be needed to take us into single digits. While a VIX drop of 30% in one month is not unprecedented, the one month in which it happened, April 1994, came on the heels of 40% and 38% monthly gains in the VIX in the previous two months. Then it was a mean-reverting move; this time it won’t be.

Another factor that argues against a large VIX drop is VIX seasonality. As I have previously discussed, the VIX has a tendency to bottom out in June, before spiking dramatically in July, August and September.

Finally, it is always interesting to look at the implied volatility of VIX options. While these have dubious predictive value (see the lack of advance warning for February 27th in the preceding link, which mirrored the complacency prior to the May 2006 selloff,) it is worth noting that VIX IV is sitting just above the 52 week low.

In sum, while I think Adam’s VIX implosion scenario is highly unlikely, I’ll refrain from saying that it cannot happen. I applaud Adam for going out on a limb and being provocative, but with my VWSI looking out 10-20 days, I see the most likely scenario as the VIX continuing in a range of about 12.50 – 15.00 for the next options cycle. Not an exciting prediction, to be sure, but one which will provide me with an opportunity to harvest some theta.

Wednesday, June 13, 2007

Three Out of Four, Unlucky or More

You will have to excuse me for using a title that sounds like a nursery rhyme, but one of the things that I discovered during the Trivial Pursuit fad years was that my childhood was seriously deficient in nursery rhymes.

Fortunately, the condition is relatively benign, but it has been know to manifest itself in my adult life via the occasional lapse into Seuss meter and some silly sounding blog post titles…

But enough about me; volatility is the real star here.

How volatile has volatility been lately?
That’s never an easy question to answer, but with Excel Ginsu, I am always able to come up with at least two or three different answers. Try this one on for size: three out of the past four days have seen changes in the VIX of 13% or more…and this has only happened two other times in the last 15 years. You probably know those other two instances well: February 27 – March 2, 2007 and June 12 – 16, 2006. Each of these instances fell just prior to an important bottom.

Does this mean a bottom is just around the corner? Hardly…but I crunched some more numbers just to be on the safe side. It turns out that these three days out of four volatility clusters are generally associated with intermediate market bottoms and not market topping action. So while this action may look toppy to some, historically it is much more bullish than bearish.

Of course, now I am left to ponder how to best identify a toppy market through the eyes of the VIX. My hunch is that Bollinger band width may be a key here, but I’ll give this one some more thought and report back when I have something of interest to say.

Tuesday, June 12, 2007

Some Recent Links to Ponder

…or at least for me to archive for easy retrieval in the future.

Monday, June 11, 2007

On Short-Term VIX Mean Reversion and Echo Volatility

A reader asked a question about the relationship between the magnitude of short-term VIX mean reversion and the implications for long-term mean reversion and echo volatility.
After doing some research, it turns out that this is a very important question. Specifically, there is a strong inverse relationship between the magnitude of short-term VIX reversion and the continued strength of the longer-term mean reversion trend. Said another way: if the VIX snaps back dramatically in a couple of days, it is more likely that echo volatility (VIX aftershocks, if you prefer) will be an important factor in the next few weeks.

On the one hand, this should not come as a surprise: if most of the mean reversion happens in a couple of days, then less of that same mean-reverting move remains for later. On the other hand, my research suggests that you can use the magnitude of the short-term mean reversion move to measure the magnitude of the long-term mean reversion with surprising accuracy – at least with the benefit of 20-20 hindsight. Whether the future will mirror the past remains to be seen.

Of course, the larger question involves expanding the implications of this finding from the VIX world to the world of the SPX and the broader markets. In this arena, the data look to be encouraging as well.

Arrow up on the predictive value of the VIX for the broader markets.

Sunday, June 10, 2007

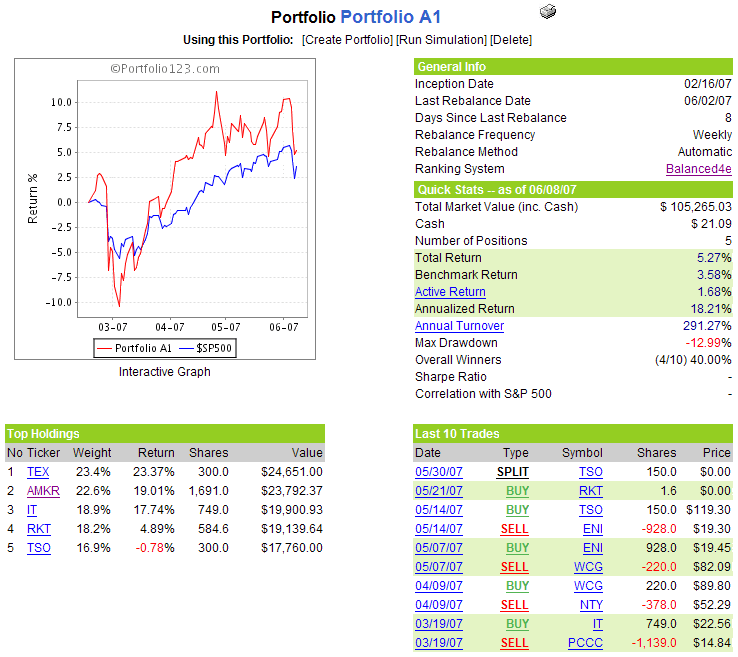
Selloff Tests Portfolio A1

Portfolio A1 muddled through a difficult week in the markets, with losses of 7.1% in Tesoro (TSO), 5.3% in Rock-Tenn (RKT), and 4.5% in Terex (TEX) accounting for the bulk of the damage. As a result of the three hard hits, the portfolio’s margin over the benchmark S&P 500 index has fallen all the way from 4.75% to 1.70%. The coming week should provide a good test of the resilience of the portfolio’s holdings. Frankly, I would expect to see some changes if we don’t see signs of improvement in the options expiration week ahead.

There are no changes to the portfolio for the coming week.

A snapshot of the portfolio is as follows:

VWSI Spikes to -9 on Thursday; Finishes Week at -1

Last week in this space I opined:

“…following the VIX Weekly Sentiment Indicator (VWSI) is a little bit like undertaking a police stakeout: lots of waiting around for a chance to be tipped off to something significant – that may or may not be just around the corner. You never know when something important is about to happen, so it is important to pay attention and be able to react quickly to what develops.”

As it turns out, volatility was indeed just around the corner, with the VWSI cresting intra-day Thursday at -9 when the VIX spiked over 23% in one day, then snapping back to a VWSI of -1 by the end of Friday, after the VIX reversed direction and sank 13%. All told, the VIX ended the week up 16.1% to 14.84, which is the highest weekly close since March 16th.

With a current VWSI of -1, the most likely scenario for the next week or two is for the VIX to drift sideways to down a little.

(Note that in the above temperature gauge, the "bullish" and "bearish" labels apply to the VIX, not to the broader markets, which are usually negatively correlated with the VIX.)

Wine pairing: A VWSI of -1 is a perfect excuse for a pinot noir – in the unlikely event that an excuse is ever needed. Popularized in part due to the excellent 2004 movie Sideways, pinot noir has been on a roll for the last couple of years. Given that I live just a 45 minute drive from Russian River Valley, which happens to be home to many of the world’s best pinot noir producers, it is not surprising that this is a personal favorite as well.

Since this is my first pass at pinot noir in the wine pairing segment of my ramblings, I will steer clear of highlighting a particular wine and instead direct the reader to Zin and Pinot, a blog that I have set aside to talk about zinfandel, pinot noir “and more.” Even though zin gets top billing in the blog title, so far I have devoted considerably more real estate to discussing pinot noir – and have also included a list (with links, of course) to my dozen favorite pinot noir producers.

Friday, June 8, 2007

Short-Term VIX Forecast

Based on historical precedent, I am forecasting that the VIX will snap back about 9% in the next three trading days and 12% over the course of the next five trading days. This gives me the following end of day price targets for the VIX:
Tuesday, June 12th: 15.52
Thursday, June 14th: 15.01

It will be interesting to see how closely the current VIX spike tracks with historical standards.

Thursday, June 7, 2007

How Overextended is the VIX?

In a word: excessively.

With the VIX currently up almost 14% to 16.96 in what is now a four day bounce, today's VWSI threshold numbers, which are good for generating setups for mean reversion plays are:
VWSI -8 at VIX 17.03
VWSI -9 at VIX 17.09
VWSI -10 at VIX 17.76

Keep in mind that most four day VIX moves will reverse dramatically over the course of the next few days. In fact, this may be a good time to review some post-spike VIX tendencies I spelled out following the February 27 VIX spike.

VWSI at -6 when the VIX hits 16.35 -> short the VIX

This is my signal to go short the VIX. I'm starting with credit spreads: the June 15 / 17 calls and the June 16 / 18 calls.

Pre-Lebron Links

Tonight is the opening game of the NBA finals and for the first time in as many years as I can remember, I not only care, but I might actually be tuning in.

On that note, let’s play linkfest…

Wednesday, June 6, 2007

The VIX and Bollinger Bands

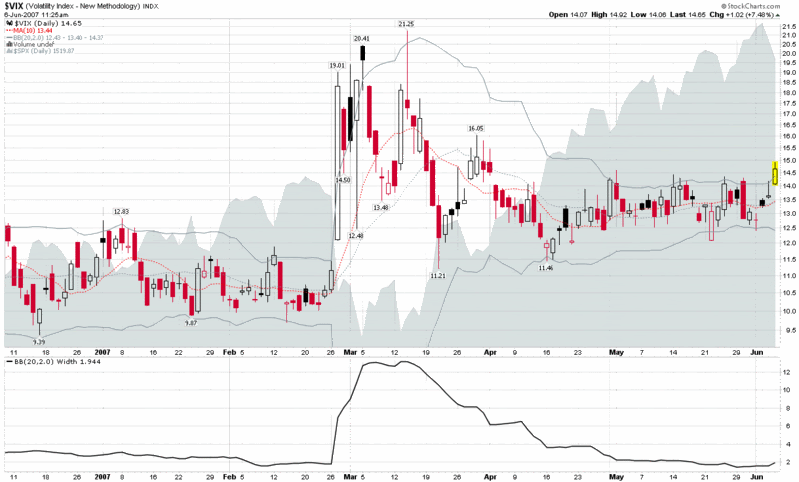
I’m not sure how I managed to fritter away five months on this blog and spend so little time talking about Bollinger Bands (BBs) and the VIX, but today seems like as good a time as any to dive right in.

First, for anyone who needs a brief refresher on what Bollinger Bands are or how they are calculated, I refer you to the StockCharts.com overview; for some thoughts on how to apply BBs to trading, OnlineTradingConcepts.com has a good summary. The best detailed source of information on Bollinger Bands comes, not surprisingly, from John Bollinger’s own site, BollingerBands.com. Unfortunately, John does not provide a lot of his thoughts on BBs for free, but you can get a good idea of his thinking from a 2001 list of his 15 basic rules.

I have included a six month chart of the VIX below, with the default (20,2,0) BB settings in addition to a BB width indicator and an overlay of the SPX. For today, I am only going to offer a handful of observations (based on this chart and some research going back past the six month cutoff):

  • When the VIX tags its Bollinger Bands, it is usually a good time to think about a VIX mean reversion play
  • When the VIX tags its Bollinger Bands, it often signals a short-term change in the SPX trend
  • VIX closes outside of the Bollinger Bands (which we are on target for today) are almost always associated with dramatic market moves and/or changes in the trend
  • When the VIX BB width drops below 1.8, it frequently signals that consolidation is ending and a sharp move is just around the corner
  • Looking back to late-March, a VIX close above 15 would definitely be significant in terms of support and resistance (we are currently trading at 14.76)

Tuesday, June 5, 2007

Ten Anecdotal/Historical Book Ideas for Investors

About a month or so ago, I finally got around to reading Marty Schwartz’s classic, Pit Bull, which I can best describe as a colorful autobiography that uses the 1980s options world as a palette for many amusing anecdotes that are expertly conveyed. The book was such a fun read that I went through the whole thing in no more than 2-3 days, cobbling together bits and pieces of ‘free time’ in order to do so.
Schwartz’s book is pure entertainment and touches only briefly on methodologies and techniques, yet I was able to pull quite a few investment-related nuggets from it in a short period of time, with the added benefit that the learning process was all fun and no pain. The process got me thinking that perhaps the fastest way to effortlessly bombard the brain with useful investment ideas are those easy reads that provide a personal historical window into the markets.

I am contrasting this process with the process I went through in trying to read and digest the ideas in Alan Farley’s The Master Swing Trader, which, despite the many interesting ideas, is about as fun to trudge through as Hegel.

With this in mind, I offer the following ten books as relatively effortless ways to cross-pollinate your investment thinking with that of some of the better minds in the field, both past and present.

Roughly in order of how quick and easy they are to read:

  • How I Made $2,000,000 in the Stock Market (Nicolas Darvas) – You can probably read this book in a little over an hour. There are only a few salient ideas, but these are destined to stick with you long after you have read the book. I also found that the path Darvas took along the way to developing his system bears a strong resemblance to my own.
  • Pit Bull (Marty Schwartz) – A fast-moving and superbly written account of a champion options trader. A great companion for a cross-country plane trip.
  • Reminiscences of a Stock Operator (Edwin Lefevre) – This is on almost everyone’s reading list, so I will say little about it, other than to point out that it is chock full of insight, yet still reads like a novel.
  • A Journey Through Economic Time (John Kenneth Galbraith) – A very different book from the others on this list, this is certainly one of the easiest economics reads out there, yet the survey of the economic landscape from WWI to after the fall of the Berlin Wall will give the reader a lot to think about.
  • My Life as a Quant (Emanuel Derman) – Another physicist who writes extremely well, Derman provides a thoughtful accounting of his personal journey through the (then) unlikely intersection of theoretical physics, finance and risk.
  • Investment Biker (Jim Rogers) and Adventure Capitalist (Jim Rogers) – These two books are probably best read back to back, in chronological order, starting with the Investment Biker’s 1990-1992 world tour, then using the 1999-2001 Adventure Capitalist jaunt to see how the world had changed over the course of a decade. This is first-person global macro analysis at its best, though you may not have the stamina to do your own world tour in one sitting…
  • Market Wizards (Jack Schwager), The New Market Wizards (Jack Schwager), and Stock Market Wizards (Jack Schwager) – I never thought I’d willingly place the Schwager wizards trilogy at the bottom of any list, but they end up here because they are more densely packed than the other books. Like the Jim Rogers duo, these are best consumed in small bites, on an empty stomach, leaving ample time for proper chewing and digestion. Schwager’s interview style and editing is such that he is able to deliver an astonishing amount of information in an easy to read fashion. The best news of all is that while the books are a great place for beginners to start, they somehow manage to improve with repeated reading.

Monday, June 4, 2007

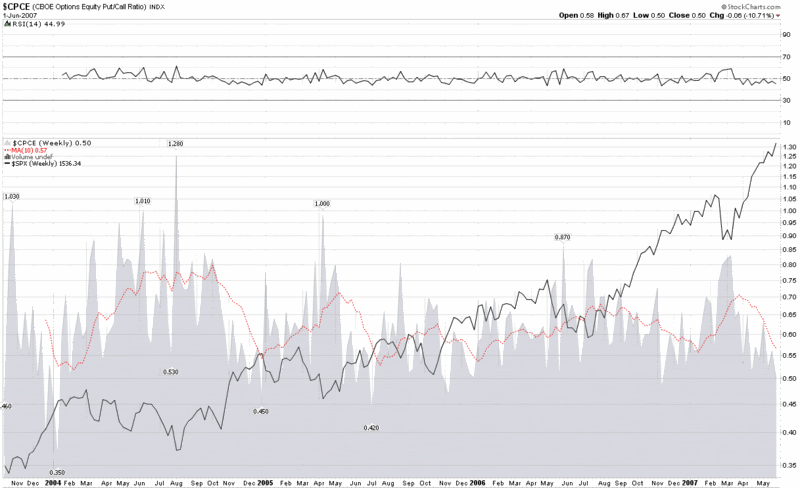
CBOE Equity Put to Call Ratio Poised to Print Warning

I am the first to admit that I intentionally give the ISEE top billing when it comes to put to call sentiment indicators. I should also point out that I am probably in the minority in doing so. I have spelled out my reasons for favoring the ISEE in the past, but today I am going to focus on a better known alternative, the CBOE’s equity put to call ratio.

I discussed the CBOE’s equity put to call ratio back in “A Sentiment Primer,” but I am returning to it today for a two reasons:

  1. it is much more widely followed than the ISEE;

  2. it is in the process of printing a significant bearish signal

Starting with the first point, the ISEE was officially launched on December 1, 2003, but the International Securites Exchange (ISE) has data going back to October 1, 2002. On the other hand, the CBOE has historical put to call data going all the way back to 1995, which means that for many years traders standardized on the CBOE put to call ratio and used it as their sole source for put to call sentiment data. Not surprisingly, the combination of a deeper historical database and longer personal experience with the data means that many still use the CBOE data today out of habit.

I should probably mention that the CBOE did not break out the equity put to call and index put to call data until October 21, 2003, but by this time they were already the well established leader and the ISEE has been playing catch up ever since.

Now to the more important part.

As the graph below suggests, when the 10 week SMA of the CBOE equity put to call ratio drops below 0.58, it has generally done a fairly good job of warning of coming market tops. Not only is the current reading down to 0.57, but as higher readings scroll off this week and beyond, you can anticipate that this ratio will go even lower. Should you be concerned? Well, even if you don’t put any stock in these types of ratios, be wary of those market watchers who do – and are prepared to take action.

If you wish to watch the equity put to call ratio more closely, SchaeffersResearch.com has a nice graph tool to play with and a data/graph snapshot to watch. StockCharts.com also has a much more comprehensive gallery graph for non-subscribers. Manic depressive traders (I know you’re out there) will probably prefer to get half hourly updates directly from the CBOE.

Sunday, June 3, 2007

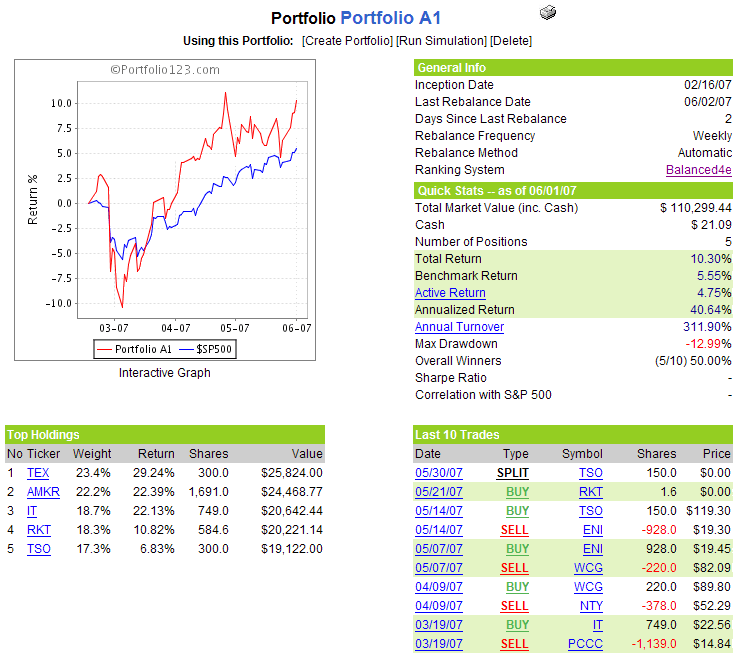
Portfolio A1 Roars Back Behind TSO and TEX

After two weeks of losing ground to the benchmark S&P 500 index, Portfolio A1 roared back last week, with all five stocks in the green. The strong performance was led by a 6.4% gain from newcomer Tesoro (TSO) and a 6.3% gain in portfolio leader Terex (TEX), which is now up over 29% in just 3 ½ months. The gains in TSO are particularly gratifying, as they allow me to get my hopes up that the fifth and final holding in the portfolio may now begin to add value rather than destroy it, as has generally been the case so far.

As shown in the graphic below, the portfolio now has a healthy 4.75% cushion on the S&P 500. This is below the year’s best 6.77% advantage from April 29th, but at least is heading in the right direction once again.

For accounting purposes, it should be noted that TSO recorded a 2 for 1 split during the week.

There are no changes to the portfolio for the coming week.

A snapshot of the portfolio is as follows:

VWSI Lifts to +3

Those who read this segment on a regular basis have no doubt probably determined that following the VIX Weekly Sentiment Indicator (VWSI) is a little bit like undertaking a police stakeout: lots of waiting around for a chance to be tipped off to something significant – that may or may not be just around the corner. You never know when something important is about to happen, so it is important to pay attention and be able to react quickly to what develops. After six relatively quiet weeks, we saw the needle on the VWSI move from zero to +3 on Friday. I’m not ready to say that this is the calm before the storm once again, but the next two weeks should certainly be watched closely for any signs of returning volatility.

(Note that in the above temperature gauge, the "bullish" and "bearish" labels apply to the VIX, not to the broader markets, which are usually negatively correlated with the VIX.)

Wine pairing: The last time the VWSI hit +3, I introduced sauvignon blanc as an appropriate wine pairing and recommended that any aspiring sauvignon blanc aficionado start their investigation into this varietal with Cloudy Bay and the Marlborough region of New Zealand. This time around, I offer up a handful of consistently excellent California producers whose sauvignon blanc can be had locally for $10 or less: Bogle; Chateau St. Jean (where it goes under the fumé blanc moniker); Concannon; Kenwood; and Sterling.

Finally, for an entertaining (think the mannerisms of Joe Pesci and Woody Allen blended with the enthusiasm of Jim Cramer) and informative look at sauvignon blanc, check out Gary Vaynerchuk's "Sauvignon Blanc Taste-Off" on wine library tv.

Friday, June 1, 2007

VIX and the Monthly Calendar

Early on in the life of this blog, when it looked as if volatility were dead and no one cared about the subject, I sliced and diced a bunch of VIX data in good ol’ Excel in an effort to identify some cycles that affect the VIX. Some of the results were particularly intriguing (the annual cycle and the FOMC cycle, for instance) and others were decidedly less enlightening.

One cycle I never got around to publishing the data for is the monthly trading calendar. The quarterly cycle and the options expiration cycle touch a little bit on the monthly cycle, but rather than interpolate at 30,000 feet, I think it is time to look at the monthly cycle more closely.

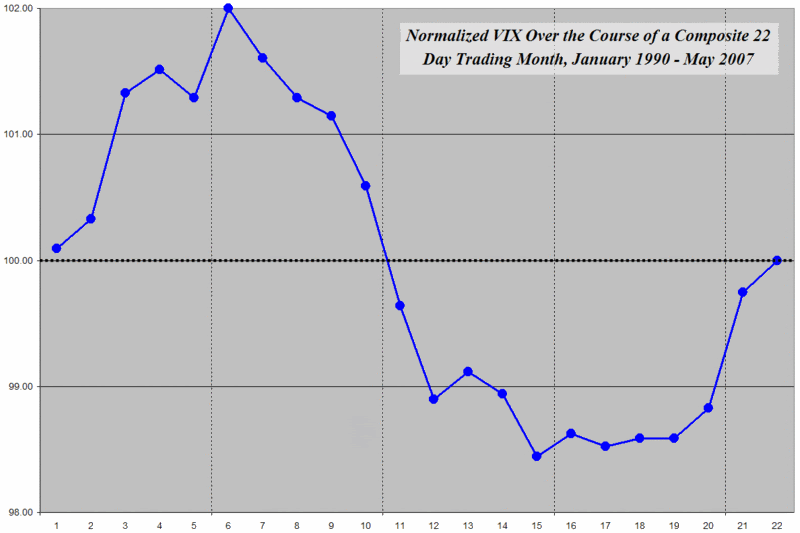
For those who may not be familiar with these charts, the graphic below translates a calendar month into a 22 day trading month, normalizes the VIX at 100, then aggregates VIX closing values for all the trading days from 1990 through yesterday. (I like to normalize the VIX in these graphs because it makes it easier to get a perspective on the magnitude of changes from point to point.)

From previous research on the options expiration cycle, I was not surprised by the dramatic fall in volatility for the week and a half or so prior to options expiration (which averages out to be the 13th trading day of each month.) I was, however, surprised to see the uptick in volatility at the end of each month that tends to run through the 6th trading day of the month. Given that the pattern of bullish moves in the markets at the end and the beginning of each month has been well documented by the likes of the Stock Trader’s Almanac and others, I was not expecting to see that the VIX tends to rise at the same time that the markets generally do the same. I have not yet developed a theory to explain this phenomenon, though I did present Bernie Schaeffer's theory a couple of months ago. As always, I encourage readers to offer their thoughts.

Finally, for those who may be interested in reviewing VIX price movements in the context of some other cycles mentioned previously on this blog, here is a short list of links to investigate:
With enough epicycles, perhaps I can eventually come up with a Ptolemaic approximation of the VIX…

DISCLAIMER: "VIX®" is a trademark of Chicago Board Options Exchange, Incorporated. Chicago Board Options Exchange, Incorporated is not affiliated with this website or this website's owner's or operators. CBOE assumes no responsibility for the accuracy or completeness or any other aspect of any content posted on this website by its operator or any third party. All content on this site is provided for informational and entertainment purposes only and is not intended as advice to buy or sell any securities. Stocks are difficult to trade; options are even harder. When it comes to VIX derivatives, don't fall into the trap of thinking that just because you can ride a horse, you can ride an alligator. Please do your own homework and accept full responsibility for any investment decisions you make. No content on this site can be used for commercial purposes without the prior written permission of the author. Copyright © 2007-2023 Bill Luby. All rights reserved.
 
Web Analytics