Tuesday, April 15, 2008

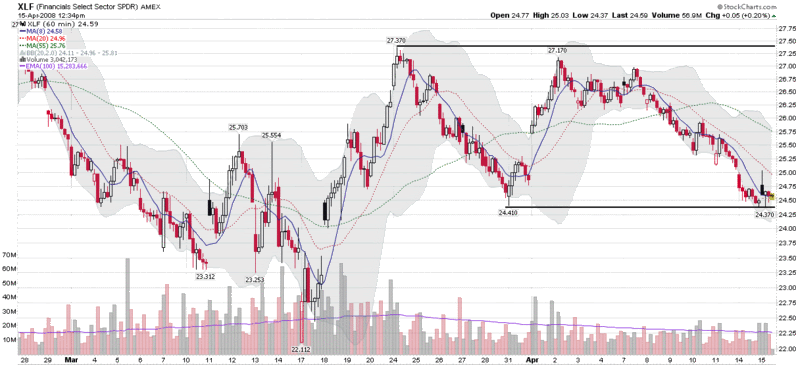
Financials Testing Critical Support Level

This morning, State Street (STT) reported a $3.2 billion loss on its investment portfolio and an additional $2.5 billion loss on conduits, then was placed on Ratings Watch Negative by Fitch Ratings, signaling that Fitch will review the company’s credit rating for a possible downgrade.

While the State Street news put a damper on financial stocks, XLF, the most widely followed ETF for the financial sector, is trading up as a write this. Earlier in the session, XLF tested an important March 31st low of 24.40 (see chart below) and has since bounced back. The 24.40 level is an important support level for the XLF and one to watch closely, particularly as tomorrow brings additional earnings reports from J.P. Morgan Chase (JPM) and Wells Fargo (WFC), as well as several smaller banks.

Monday, April 14, 2008

Three Top Bloggers Look at the VIX

Since what little ‘analysis’ there is of the VIX is usually of the quick and dirty variety, I was delighted to see that three bloggers who I have a great deal of respect for just happen to be featuring articles on the VIX this morning.

The first piece, from Condor Options, asks a basic question that I often grapple with when it comes to volatility indices: Is the VIX Impervious to Technical Analysis. I have to say that I am largely in agreement on the three main points made in the post:
  • Support and resistance don’t matter
  • Long term moving averages don’t matter
  • Correlation does not imply causation
That being said, in my opinion there are quite a few ways in which technical analysis can be applied to the VIX, but the universe of valid approach is much smaller for the VIX than it is for other indices. Part of the problem, as I have stated here on several occasions, due in part arises from the fact that in the case of the VIX, one cannot trade the underlying directly.

Ian Woodward is clearly of the camp that one can apply technical analysis tools to the VIX. In Whither Goes the Volatility Index – VIX, Ian lays out a detailed TA approach for looking at the VIX and interprets the implications for the markets based on various trading ranges for the VIX this week. I think there is some validity to Ian’s approach, but this is not how I generally use the VIX.

Last but not least, Tom Drake has an indicator that he calls the 2CS, which combines the VXO (the original VIX, prior to the 2003 modifications) and the CBOE combined put to call ratio to get a two dimensional view of options sentiment. In The 2CS Revisited, Tom discusses how he uses the 2CS to help identify market bottoms. His approach appears to be similar to mine in many respects. Also, the 2CS is clearly a relative of the OSI (Options Sentiment Indicator) that I publish and discuss in my subscriber newsletter.

I suspect the increased interest in the VIX is a by-product of the ongoing discussion in many circles that the VIX has not spiked enough to signal a textbook capitulation bottom, particularly given the magnitude of the macroeconomic concerns. I continue to think that while a VIX spike of 40 or more would placate many of those who are waiting for a more obvious sign of capitulation, this is not necessary to confirm a bottom, particularly given the current trading range of the VIX in the low to mid-20s.

VIX Back Above 10 Day SMA; VWSI at Zero

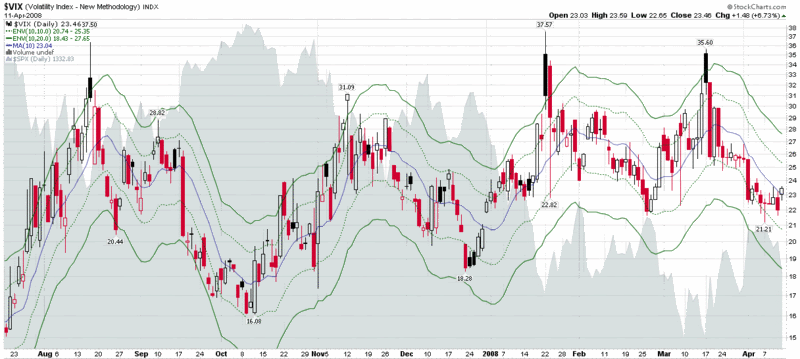
Last week's bearish action in the equity markets moved the VIX back over its 10 day simple moving average for the first time in three weeks. As the markets enter a pivotal earnings week, it will be interesting to watch the VIX to see how damaging any earnings surprises turn out to be -- or how much bad news has already been discounted.

The VIX Weekly Sentiment Index (VWSI) is back at zero, down from +3 the previous week, meaning that the volatility forecast for the next 1-2 weeks is neutral, with a roughly equal probability of a spike in volatility or a continuation of the move down.

Saturday, April 12, 2008

Avoid Subscriber Newsletter Delivery Issues

First, a quick thanks to all who have signed up for the subscriber newsletter. I have been quite pleased by the response to date.

Unfortunately, at least one subscriber has had trouble receiving the newsletter. If any other subscriber has failed to receive an issue on any Wednesday or Sunday evening Pacific Time, please drop me a note.

To be on the safe side, all subscribers are encouraged to add bill.luby@gmail.com to their email program's "approved senders list" to ensure that future issues do not end up in a spam or bulk mail folder.

Friday, April 11, 2008

NASDAQ 2315 Again

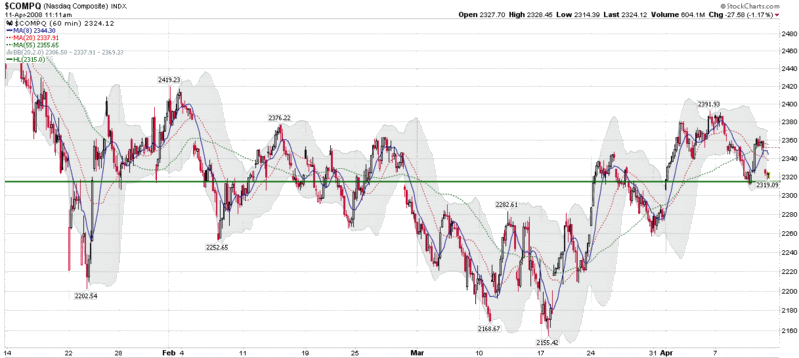
Two months ago I noted that the 2315 level for the NASDAQ Composite Index had figured prominently in several important gaps and served as a critical support and resistance level for the index going back to mid-January.

In range-bound markets – which is what we are in for now until we get a decisive move up or down – these important support and resistance levels end up being revisited on a quite a few occasions and ultimately prove to be an important measuring stick for the strength of subsequent market action.

Looking at the three month chart (with 60 minute bars) below, in the past two months the 2315 level has played an important role in two new gaps, one from the end of February and another at the beginning of April. The end of February gap down served as a ceiling for price action for almost a month, while the April 1st gap up has been the floor for price movements over the course of the past two weeks. Today’s sharp drop tested the gap and the corresponding 2315 level. So far, that test of support has held. As long as 2315 continues to hold, the markets should continue to consolidate and move up from current levels, but should 2315 be breached – and the gap down to 2290 be closed – expect emboldened shorts and panicky longs to put the 2155 low back in to play.

Thursday, April 10, 2008

Persistent High Put to Call Ratio

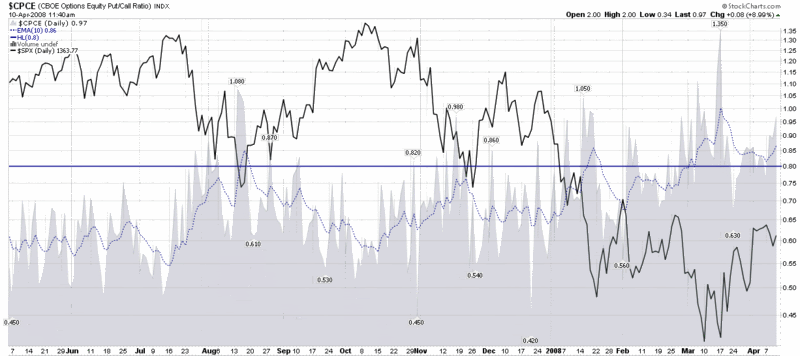
The last time I mentioned the CBOE Equity Put to Call Ratio, one month ago today, it was at such elevated levels that I titled the post Put to Call Everest and limited my commentary to a brief question, “What number comes after infinity?” The extreme put to call data even inspired me to make my first major bottom call since trying to catch the bottom in the NASDAQ in 2002 (I was also a little early then, but close enough.)

Fast forward one month and the put to call data continue to show a preponderance of non-believers, with put buying dominating the options activity. Given the headlines of the past few days, this widespread pessimism is easy to understand. The more important question is how long it will endure.

Critical market bottoms are almost always marked by a spike in put to call ratios. For aggressive investors, the current levels probably offer an attractive risk-reward profile. More conservative investors may wish to wait for a confirmation signal, such as the 10 day exponential moving average of the CBOE Equity Put to Call Ratio dropping below 0.80 (the blue horizontal line in the chart below.) More market shocks certainly lie ahead, but history suggests that the current environment has a high probability of producing above average returns – perhaps even considerably higher than that – over the next month or two.

Wednesday, April 9, 2008

Volatility Spikes Above 10 Day Moving Average

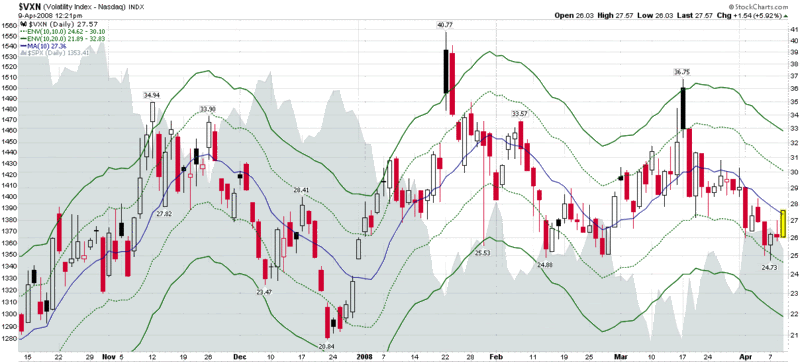
After three weeks of down trending volatility, the bearish action of the past three days has caused the VXN (volatility index for the NASDAQ-100) to reverse course and spike back above the 10 day simple moving average. As the NASDAQ-100 (NDX) has fallen more dramatically than the S&P 500 has this morning, the corresponding spike in the VIX, while similar, has not quite moved that volatility index up to the 10 day SMA.

As best as I can determine anecdotally, the use of volatility indices – particularly the VIX – to measure the ebb and flow of market sentiment has been on the rise in recent months. One of the most common ways to use the VIX is to measure the deviation from the 10 day SMA and bet that the larger the deviation, the more likely the index will rapidly move in mean reversion fashion in the direction of the 10 day SMA.

In trending markets, the mean reversion plays are excellent opportunities to add to a trend trade. When the markets are moving sideways, as they appear to be doing now, the VIX is better used as an oscillator for timing swing trades from one sentiment extreme to another.

In the chart below, I have added 10% and 20% moving average envelopes to the VXN to help define the most likely parameters of a volatility swing. While some resistance is usually evident as volatility swings back over the 10 day SMA, the opposite side of the 10% moving average envelope – a VXN of 30.09 in this case (26.09 for the VIX) – is where the volatility swing is most likely to run out of steam as it encounters stronger resistance. On the chart, the 10% moving average envelopes are represented by the dotted green lines. The solid green lines are 20% moving average envelopes; these usually signal the end of an extreme volatility swing and are more reliable mean reversion trading signals.

Tuesday, April 8, 2008

Sticky Sentiment

Back in February I received a lot of positive feedback for a post titled Intrade Prediction Markets as a Sentiment Indicator which discussed the usefulness of prediction markets as a gauge of investor sentiment. This is a theme I will come back to in due course, but for now I wanted to highlight some excellent complementary work in this area.

Expanding on prediction markets as sentiment indicator theme and drawing an interesting parallel in the sports world, Jeff Miller at A Dash of Insight has a superb post up today in which he looks at the ebb and flow of the North Carolina vs. Kansas game as a case study in investor sentiment. In Sentiment Is Slow to Change: A Basketball Lesson, Part One, Jeff uses a real-time chart of the price of the futures contract for the game from Intrade’s sister site, TradeSports.com and provides a thought-provoking analysis of the changing fortunes during the game and the betting response in the futures contract. I highly recommend that readers click over for the full story, but I have taken the liberty of posting Jeff's conclusion below:

“The lesson here is that market sentiment is very ‘sticky.’ Those investing in UNC futures were not just fans. Most were regular players of many sporting events, seeking a profit on this one. They began with an opinion, and the opinion was slow to shift.

The value of looking at an example like this is that the entire picture of sentiment and reality can be captured in the space of a few hours.

In the stock market, a similar process may take many months or even years. We shall explore this further.”

I am certainly looking forward to the next installment in this series.

Monday, April 7, 2008

M3 Expanding at Rate of Almost 20%

There are many excellent web sites out there that specialize in a small slice of the economic universe, as VIX and More does, and in due time I’d like to think that I will be able to shine some light on most of the better ones.

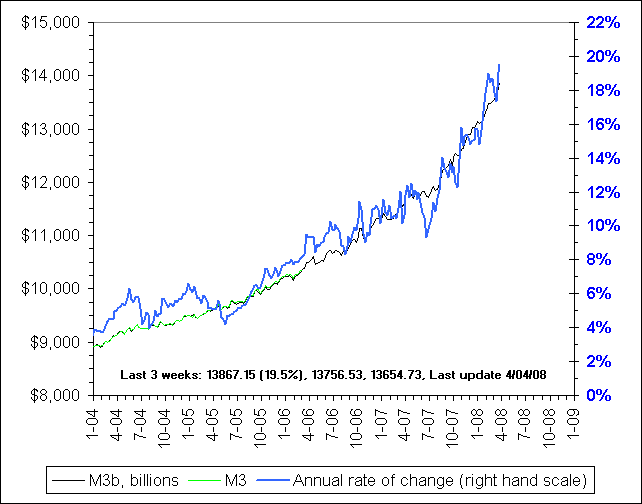
When it comes to the money supply, one of the best ones is NowAndFutures.com, run by a self-described “small group of middle aged and older investors who got fed up with the lack of straight and relatively simple data on investing and economics, and put up a web site to address our various concerns.”

One of the subjects in which NowAndFutures excels is the money supply. Specifically, when the Fed decided back in March 2006 to stop publishing M3 data, NowAndFutures stepped up with their own M3 model and started publishing what they are calling M3b – a very close approximation to the discontinued M3 number.

I mention all of this because the recent moves by the Fed to inject liquidity in the system are starting to show up in the money supply data, including the M3b calculation, which is depicted in the NowAndFutures graph below. In some respects, volatility is the opposite of liquidity, so those who are wondering why the VIX has a 21 handle and is trading below the 200 day SMA for the first time in months can look to the recent dramatic expansion of the money supply for a large part of the explanation.

Sunday, April 6, 2008

VWSI at +3 as VIX Keeps Falling

The VIX fell 3.26 (12.7%) to end the week at 22.45, the lowest end of the week close for 2008 so far. Last week's move brings the drop in the VIX to 8.71 points or 28% over the past three weeks and brings the index to a level about 8.9% the 10 day SMA and 15.3% below the 20 day SMA.

While these may sound like fairly extreme readings, the VWSI has only ticked up from +1 to +3 in the past week (but up from -4 three weeks ago), suggesting a most likely scenario of only a mild increase in volatility over the next week or two.

With all the recent attention being given to the VIX and the 200 day SMA (currently at 22.90), I thought I should weigh in by expanding upon some comments I have made previously. Specifically, it is my opinion that technical analysis does not work well with a derivative in which one cannot trade the underlying. Part of my thinking is that there is no such thing as support for the VIX at the 200d SMA (or any moving average) because one cannot trade the VIX directly when it hits a support (or resistance) point. In a more general sense, many TA techniques are on shaky ground with derivatives in which the underlying is not traded, so I am skeptical about the value of technical analysis of the VIX.

That being said, if enough people use the VIX as a market timing tool, some of the market's response to important TA VIX signals can filter down to the VIX itself and have somewhat of a reinforcing effect. I suspect that the effect, if any, is quite small.

Those who want to eyeball the significance of the 200d SMA are encouraged to look at a chart of the VIX with the 200d SMA going back 5 years or more. The only time that the 200d SMA appears to have served as even minor support or resistance was in July 2006 -- and that looks more like a small coincidence on the long-term chart than solid technical support. For the most part, the 200d SMA has been irrelevant throughout the history of the VIX -- and there is no reason to think that fact should change in the present environment.

Friday, April 4, 2008

Chinese Solar Stocks on the Rise

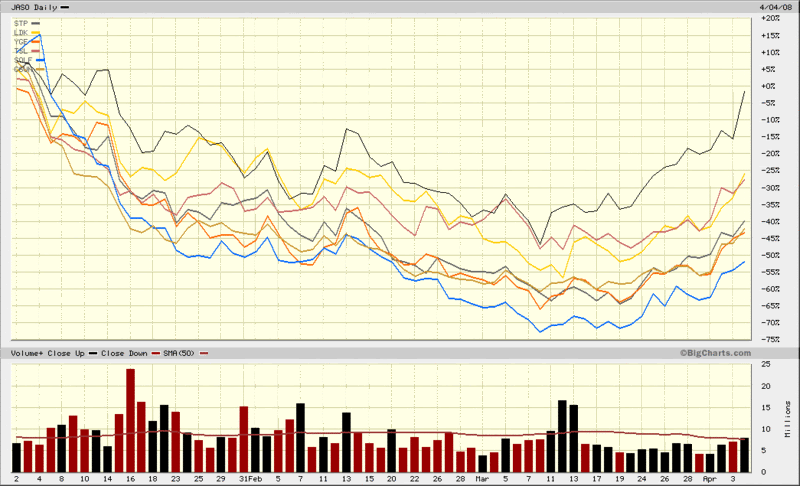
Two areas that have been rife with speculative frenzy – both bullish and bearish – over the past year or so have been China and solar stocks. Not surprisingly, the space where the two intersect, Chinese solar stocks, has been one of the most volatile segments of the market.

I have elected not to show the long-term chart of these stocks, which looks a lot like a higher beta version of the chart of the FXI. Instead, the chart below compares the year-to-date performance of the most significant players in the Chinese solar space that are traded on US exchanges: JASO; STP; LDK; YGE; TSL; SOLF; and CSUN. I left JASO as the anchor and show the volume in this stock at the bottom of the chart because JASO is the biggest gainer of the year so far and the chart shows that after the March 10th bottom, strong volume flowed into the stock over the next three days, marking the beginning of the current leg up.

Given their high profile and speculative history, Chinese solar stocks can be an excellent speculative barometer, not only for China and the solar sector, but for the markets as a whole. More importantly, where there is strong speculative activity, particularly coming off of a sharp bear move, there is increased confidence in the markets and a high degree of perceived opportunity.

Thursday, April 3, 2008

Equities or Commodities?

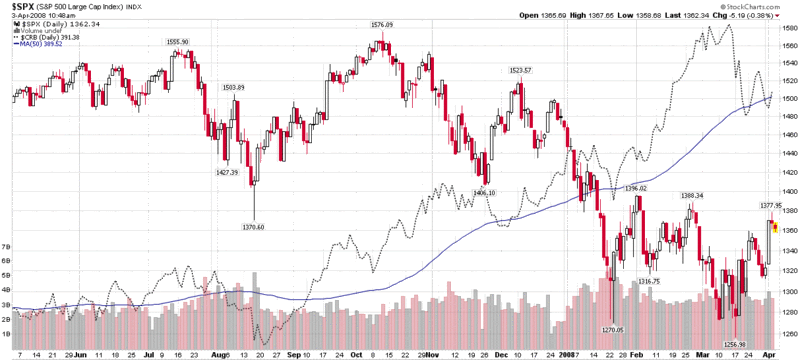
Ever since the bear market of 2000-2003 found a bottom and started up, equities and commodities have largely been moving up together. That relationship came to an end when the equity markets topped in mid-October. Since then, as the first chart below indicates, the SPX has been falling while the Reuters/Jefferies CRB Index of commodities has been on the rise. While the direction of these indices has recently changed, the inverse relationship appears to be holding up. The SPX and CRB chart below shows that commodities turned down about two weeks ago, just before the equity market bottomed.

A quick and dirty explanation for this change might be that speculative money started getting out of equities last August and September as the market topped, concerns were raised about the credit markets, and the Fed started cutting rates. The Fed’s actions clearly caused many investors to be more concerned about inflation and pushed them in the direction of assets – such as commodities – that have historically performed well in an inflationary environment.

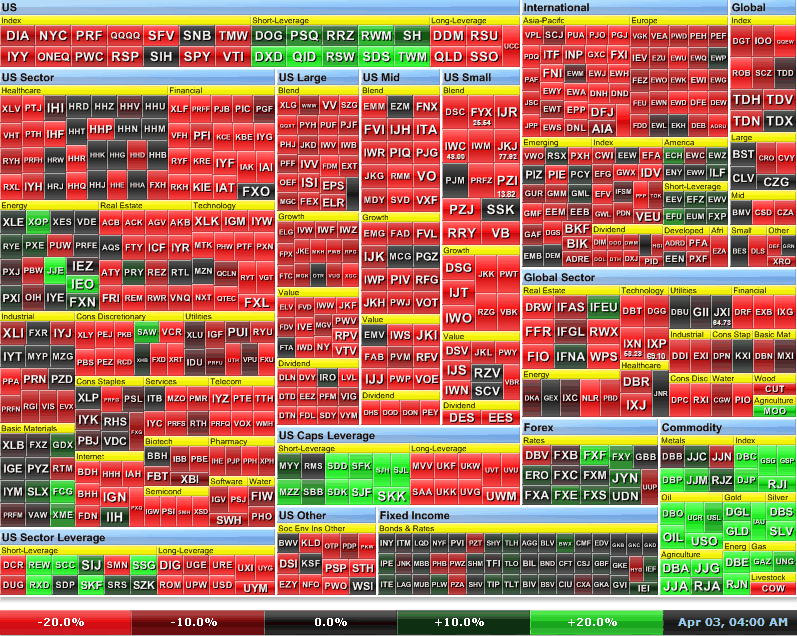
In addition to the StockCharts.com SPX and CRB chart, I have also included a six month heat map, courtesy of FINVIZ.com, which shows in dramatic fashion, that commodities have been one of the few areas of strong performance during the past six months.

As financial firms de-leverage, it is possible that speculative bets will be limited to equities or commodities, but not both, so it is important to watch which asset class is soaking up most of the money currently on the sidelines. I will update this story as it unfolds.

[graphic: StockCharts]


[graphic: FINVIZ.com
]

Wednesday, April 2, 2008

Portfolio A1 Performance Through 3/31/08

After I decided to stop posting an update to Portfolio A1 each weekend, I was surprised and pleased to hear that several readers were using the portfolio’s selections to augment their own holdings.

With that in mind, I thought it might be interesting to update Portfolio A1’s performance through the first quarter of 2008 – and thereafter on a quarterly basis.

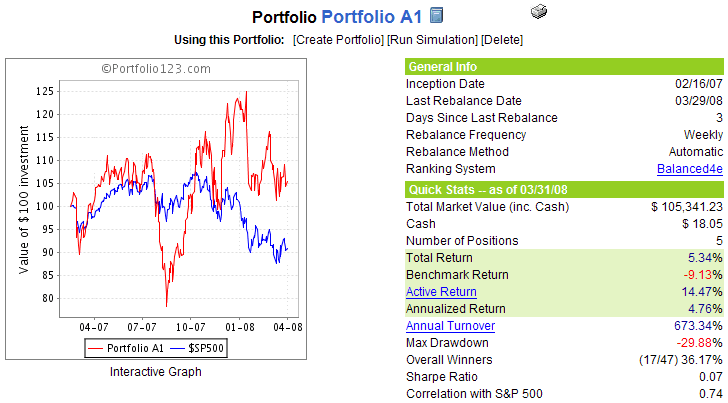
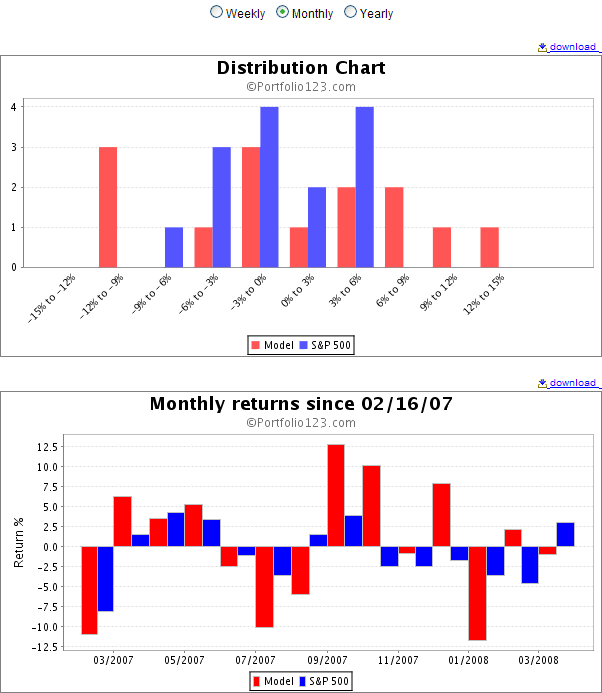
As the graphics below show, the Portfolio suffered its worst month to date in January, breaking a string from September through December in which the portfolio annihilated the benchmark S&P 500 index. Despite the relatively disappointing performance in the first quarter of 2008, from a cumulative return perspective, Portfolio A1’s 5.3% return since the February 16, 2007 inception is still 14.4% better than the 9.1% loss suffered by the SPX during that period.

I should note that the new VIX and More Subscriber Newsletter has three model portfolios that are updated weekly: Aggressive Trader; Growth; and Foreign Growth. These were publicly launched in the newsletter on Sunday, but for the record, each of the three model portfolios have been up and running for the past 3-4 years and have significantly outperformed both the SPX and Portfolio A1 during comparable measurement periods. Finally, there is also a Stock of the Week ‘Portfolio’ whose performance I will be tracking partly for posterity and partly for entertainment value. For more details on the subscriber newsletter, click on the link in the upper right hand corner of the blog.


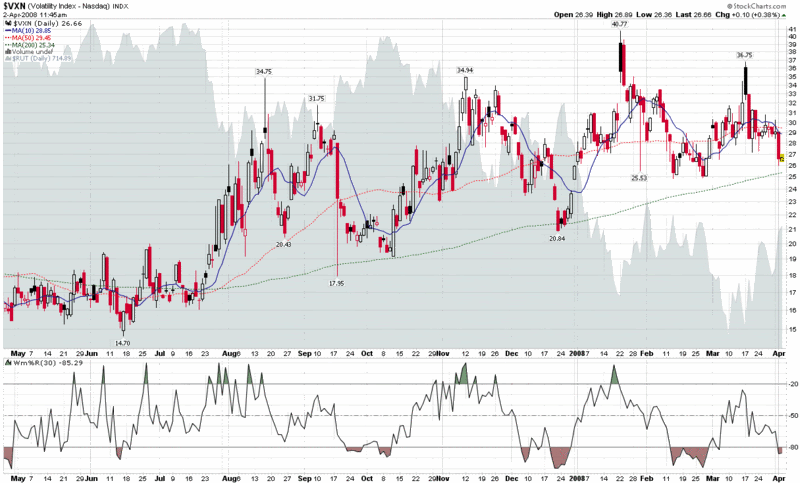
Turning to the VXN…

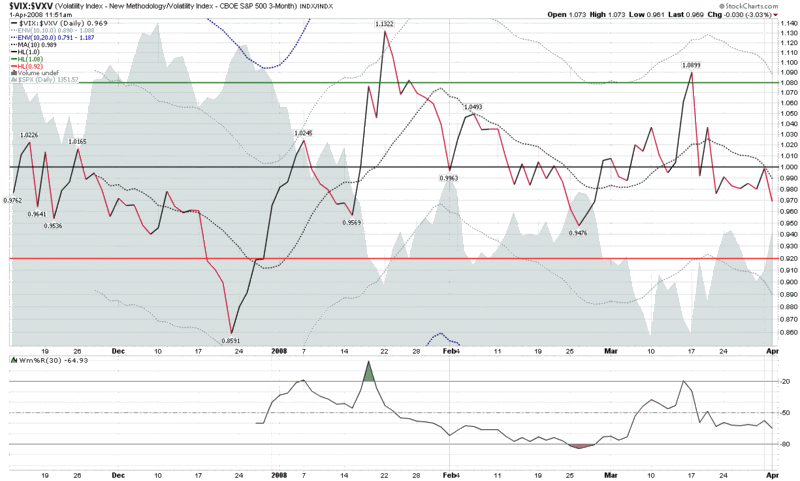
Yesterday, I presented a chart of the ratio of the VIX to the VXV and offered the interpretation that this indicator was suggesting little more than a mild overbought condition.

Now that we have a 400 point rally in the DJIA in the books, it seems that quite a few pundits are pointing to the VIX and calling the market overbought. Yesterday I barely stopped short of saying that the study of the percentage deviation of the VIX from the 10 day SMA is the “lazy man’s way to interpret the VIX,” but truth be told, that is about where I come down on the subject (with apologies to all the women who fall into the same trap.)

Yes, it is important for traders to keep their stable of indicators simple and easy to manage, but in doing so there is always the risk of oversimplification.

Getting back to the VIX, it is down another 0.18 (0.8%) as I type this, while the SPX is up 0.44%. I’m sure that makes the 10%ers even more convinced that the market is about to pull back, but I am not prepared to accept that interpretation. The VIX:VXV ratio continues to move sideways today and other volatility measures – which I vow to give more space to going forward – show more of a range-bound pattern than anything resembling the plummeting volatility that the 10%ers are undoubtedly seeing in the VIX.

Recall that financials are the largest component of the SPX, which means they also have the heaviest weighting in the VIX (the same is true for the S&P 100 index, a.k.a. the OEX, and its volatility counterpart, the VXO.) That being said, now that the Bear Stearns (BSC) situation has been resolved, the Fed has expanded its role to enhance the liquidity of the investment banks, and Lehman Brothers (LEH) appears to be out of the woods after experiencing strong demand for its $4 billion convertible preferred offering, it should come as no surprise that volatility which is closely tied to the financial sector is showing the steepest drop. As an example, the most closely watched financial sector ETF, XLF, has seen volatility drop 36% since the March 17th high. By the same token, falling volatility has taken the VIX and VXO down below their 200 day simple moving averages. Move over to the VXN (the volatility index for the NASDAQ-100 or NDX), however, and the picture is much less dramatic. Instead of falling volatility, the chart shows range-bound volatility going back to August 2007 and current readings still comfortably above the 200 day SMA, albeit with a pattern of higher lows. Given the relative weightings of the financial sector in the various volatility indices, from my perspective a strong break in the VXN below 25 would be a better broad-based sign of falling volatility than most of what we can discern from the VIX and the moment.
Tuesday, April 1, 2008

VIX:VXV Not Signaling Overbought Market

With the VIX trading at its lowest level (23ish) since late February, there are a number of investors who are trying to determine whether a falling VIX signals an overbought situation in the market.

There are many ways to use the VIX as a market sentiment indicator to assist in calling tops and bottoms. The most widely used is probably to determine the distance the VIX is from the 10 day simple moving average and get long if the VIX is 10% above the 10 day SMA and short if the VIX is 10% below the 10 day SMA. A simple plot of the VIX and the appropriate moving average envelopes will do the trick here – and also indicate that the markets are currently in an overbought condition.

Another way to use the VIX – and one which I continue to have high hopes for as the historical record evolves – is to use the ratio of the VIX (30 day implied volatility for SPX options) to the VXV (93 day IV for the SPX options) to determine the extent to which current volatility readings deviate from future volatility expectations. I have discussed this VIX:VXV ratio on a number of occasions and have continued to observe the predictive value of extreme readings. Now that I have the benefit of 4 ½ months of VXV data, I can say that the ratio continues to generate useful readings – and suggests that the current market is not particularly overbought (see chart below.)

I will continue to monitor instances in which the SMA +/- 10% rule and the VIX:VIX ratio rule(s) diverge and provide periodic updates in this space.

DISCLAIMER: "VIX®" is a trademark of Chicago Board Options Exchange, Incorporated. Chicago Board Options Exchange, Incorporated is not affiliated with this website or this website's owner's or operators. CBOE assumes no responsibility for the accuracy or completeness or any other aspect of any content posted on this website by its operator or any third party. All content on this site is provided for informational and entertainment purposes only and is not intended as advice to buy or sell any securities. Stocks are difficult to trade; options are even harder. When it comes to VIX derivatives, don't fall into the trap of thinking that just because you can ride a horse, you can ride an alligator. Please do your own homework and accept full responsibility for any investment decisions you make. No content on this site can be used for commercial purposes without the prior written permission of the author. Copyright © 2007-2023 Bill Luby. All rights reserved.
 
Web Analytics