Friday, February 22, 2008

The Rising Popularity of XLF Options

Earlier in the week, I looked at the decreasing volume in VIX options in Interest in VIX Waning? Over the course of my analysis, I attributed some of the decline in VIX options to the launch of QID (and SDS) options back in November.

While the QID and SDS are undoubtedly stealing some market share from the VIX for those looking at leveraged hedging opportunities, a much bigger factor has been the meteoric rise in interest in options for XLF, the financial sector SPDR.

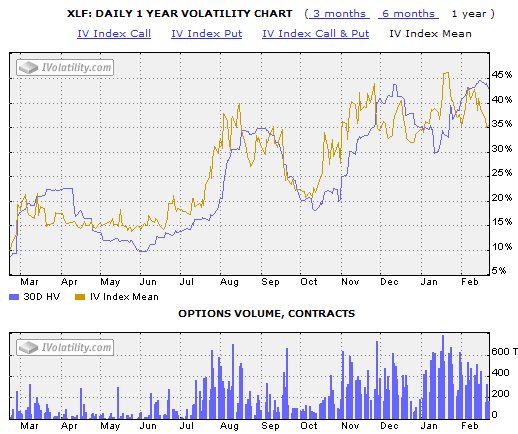
As the graphic below demonstrates, XLF options were not actively traded until July 2007. After a surge in interest in mid-summer, volume dropped off until November, at which time implied volatility and options volume both rose dramatically. By means of comparison, back in June 2007, XLF and VIX options traded in roughly equal numbers, but so far in 2008, XLF options volume has been outpacing VIX options volume by about five to one. Additionally, I find it noteworthy that a there has been a sustained increase in XLF options volume since the beginning of November – the same time that VIX options volume peaked and started to decline.

There are several other features of the XLF implied volatility chart that are worth pointing out. One of which is that implied volatility and options volume have moved in almost perfect lockstep over the past six months. Another point of interest is that XLF implied volatility peaked just as the major indices bottomed in January. A break below the current 35 support level might signal a lessening of put activity in the financial sector and perhaps indicate that the January bottoms are a good bet to hold.
Thursday, February 21, 2008

Intrade Prediction Markets as a Sentiment Indicator

Intrade.com is a fascinating place to park your brain from time to time. At this prediction market site, users can buy and sell binary options contracts that allow them to place bets on whether a future event will happen. Intrade has a broad range of contracts that cover everything from whether Osama Bin Laden will be captured by a particular month, which country will host the 2016 Olympics, what the year’s snowfall will be in New York City, and a wide variety of bets about the US election.

Prediction markets have received considerable press and academic attention for their purported ability to provide a better predictive view of the future than that of individual experts. Evaluating the arguments on both sides of this issue is beyond today’s scope, but those who are interested in reading about these claims may wish to start with Prediction Markets: Does Money Matter? by Servan-Schreiber, Wolfers, Pennock and Galebach and move on to prediction markets as a proxy for probabilities in Interpreting Prediction Market Prices as Probabilities by Wolfers and Zitzewitz. For an excellent broad introduction to prediction markets, I recommend Prediction Markets, also by Wolfers and Zitzewitz.

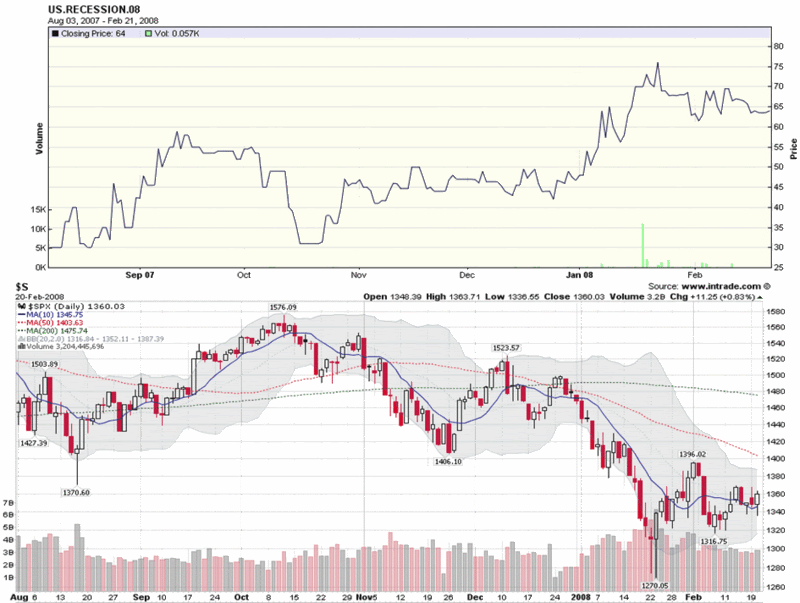
Unfortunately, the volume of trading activity for the financial and economic prediction markets contracts are not as popular as those for politics and entertainment. I do think, however, that there is considerable potential value not only in establishing probabilities for future events, but also gauging investor sentiment. At the moment, the most heavily traded financial contract at Intrade is whether the US will go into a recession in 2008. I have included a chart of that contract, which goes back to August 2007, in the graphic below, which compares estimates of the probability of a recession with the SPX during the same period. While there is a very high negative correlation here (i.e., we have yet another contrarian sentiment indicator working), I find it particularly interesting that the expectations for a 2008 recession peaked just as the SPX was making its January bottom.

If only there were a little more volume in the financial contracts, I suspect there would be quite a few more gems to pluck from the prediction markets. Until then, they are still a great place to get a sense of what the odds are that Barack Obama wins the Democratic nomination or Barry Bonds will be found guilty of one or more of the perjury and obstruction charges he is facing.

Wednesday, February 20, 2008

Speculation in Commodities vs. Technology

During the course of the five year bull market that appears to have ended last October, the technology and commodities sectors have been two areas where a considerable amount of speculative money has flowed in search of extraordinary returns.

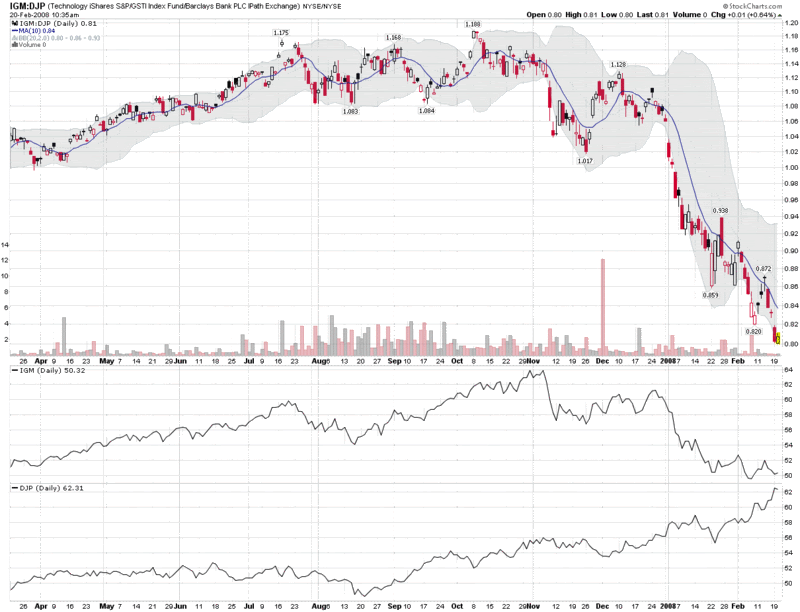
Since October, money has flowed out of technology, as indicated by the action in IGM, a popular technology ETF. Conversely, speculative money has been flowing in large quantities into commodities, as the action in gold, agriculture, oil, natural gas and other commodities can attest to. While there are a number of commodities indices and ETFs out there, many of them (notably the CRB Index, but also the GSCI) have such a heavy weighting in oil and gas as to make them de facto energy indices and not a good proxy for a broader representation of industrial metals, precious metals, agricultural commodities and the like. For this reason, I have chosen to highlight the iPath Dow Jones AIG Commmodity Index (DJP) as my broad-based commodities benchmark (the Rogers International Commodity Index, ticker RJI, is also broadly diversified, but is only it its fifth month of operation.)

Looking at a ratio of the IGM and DJP ETFs or stacking them on top of each other, as I have done below, you can see the flow of speculative money out of technology and in to commodities. For those seeking a strong upward trend in the current downturn, commodities represent an excellent opportunity. Conversely, when speculative money starts flowing out of commodities and back in to technology, expect to see the NASDAQ and other broad indices stage a more sustained move to the upside.

New ETFs?

So I'm thinking about a couple of new ETFs that are in the can't miss category:

  1. FadeTheOpenETF -- fades any opening gap of 1% or more, with a PSAR trailing stop

  2. ShortTheFedSpeechETF -- goes short the major indices (or at least the financials) 10 minutes before any Fed member speaks and doesn't close out the position until the markets have a session in the green

Perhaps in a couple of years, you can have a full ETF trading strategy menu, so that just before the open each day, you can absorb all the news and click on a couple of strategy boxes, then watch the ETFs do all the work for you.

Which obvious ETF winners am I missing?

Tuesday, February 19, 2008

Interest in VIX Waning?

A number of readers have wondered whether the recent lack of volatility in the VIX in the face of a strong market downturn indicates that the VIX is losing some of its relevance. This is a fair question.
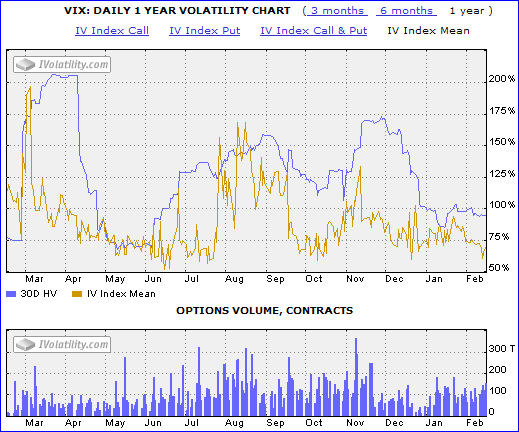
As the graphic to the right indicates, not only is the implied volatility and historical volatility of the VIX currently hovering near 52 week lows – when clearly investor fear is not similarly lax – but since about mid-November or thereabouts, the volume of VIX options traded has dropped dramatically as well. In fact, with the benefit of hindsight, it appears that the popularity of VIX options surged from May through November of 2007, only to have recently returned to the levels that preceded the anxiety over the subprime problems and all the dominoes since uncovered that appear to have been within tipping range.

Of course, if the VIX’s beta starts dropping below historical levels, it is possible that we may have a situation in which, as I described previously, the less the VIX moves, the less valuable (reliable) it becomes as a highly leveraged hedge against long market positions.

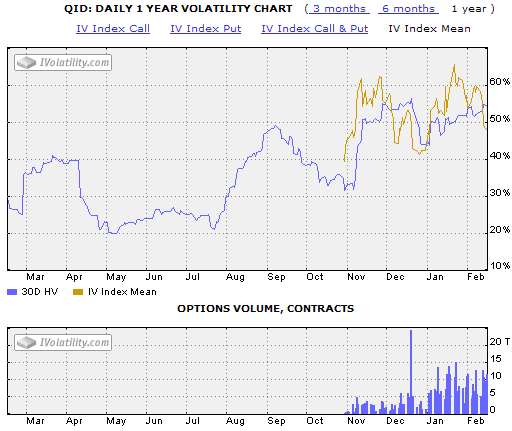
One of the theories about the lack of action in the VIX is that those who are looking for another way to have a highly leveraged hedge have flocked to the inverse and double inverse ETFs. Did anything happen in November that might support that theory? Well, lo and behold, it turns out that the most popular of the double inverse ETFs, the QID, just happened to start trading options in November. Coincidence? I suspect not. While the volume of QID options relative to VIX options is rather small, clearly the game has changed.

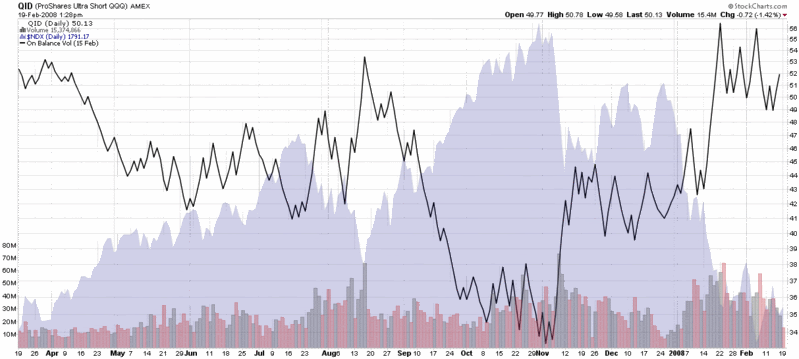
This observation is not going to persuade me to change the name of the blog, but don’t be surprised if you see me posting about the QID more often. After all, as the chart on the bottom shows, QID volume (and on balance volume) has demonstrated considerable predictive potential over the past year.


Portfolio A1 Beats SPX by 15.5% in First Year, Helped by Commodity Theme

With two of the five focus positions in agriculture and energy, the commodities theme has been good to Portfolio A1. W&T Offshore (WTI), the oil and gas exploration and production company, is now up 15.4% in the two weeks it has been in the portfolio. Last week’s biggest winner was Terra Industries (TRA), which posted a 10% gain for the week, moving up with the red-hot nitrogen fertilizer space.
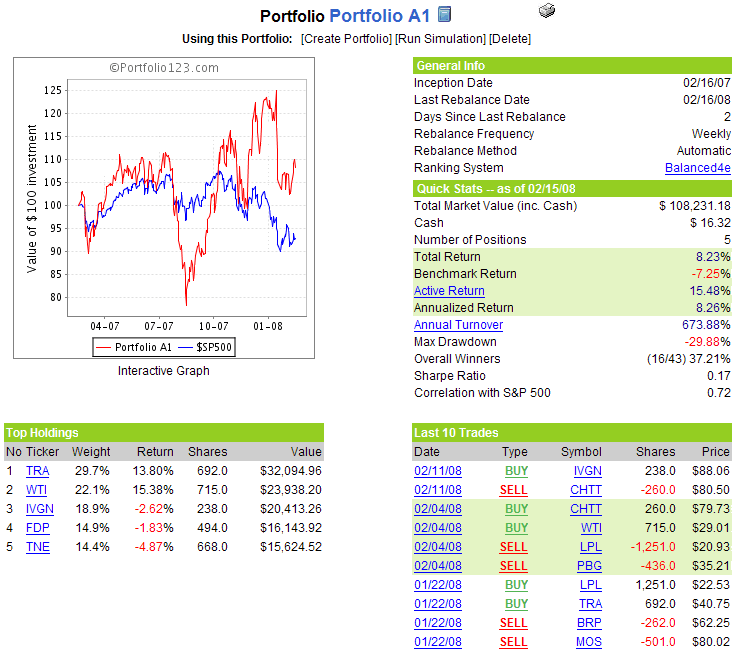

After one full year of performance (since the February 16, 2007 inception), Portfolio A1 officially goes in the books with a return of +8.23%, compared to a -7.25% move in the benchmark S&P 500 index over the same period, a net performance gain of 15.48% by the portfolio over the benchmark.

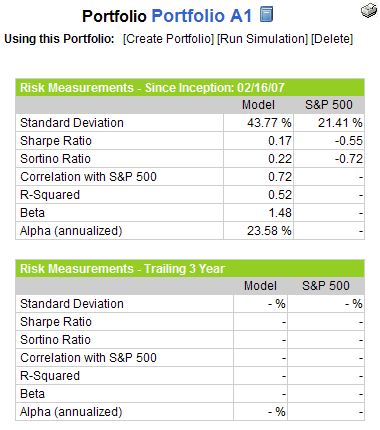
In terms of risk-adjusted return, the graphic to the right shows that Portfolio A1 has had an average beta of 1.48 and an impressive annualized alpha of 23.58% during the first year that the portfolio has been up and running.

In many respects, this portfolio was established to provided focused approach to "fishing for whales." That approach has been largely successful if a little inconsistent during the first year, landing such strong momentum stocks as of MOS, DRYS, TEX, PBR, RIO and others. Part of what makes finding so many big winners possible is a very high annual turnover. At 674%, this is clearly a trading portfolio, not a buy and hold approach. Losses are generally cut quickly and a new hook goes over the transom almost every week. I look forward to seeing how the portfolio fares in the second year, as we begin that year with what looks to be an extremely challenging investment environment.

More Sideways VIX and VWSI Action While ISEE Plummets

From a volatility perspective, 2008 continues to unfold in a curious manner. The markets are decidedly bearish – and even when they briefly recover or drift sideways, the doom and gloom headlines continue to cast a long shadow over investors’ expectations about the markets going forward. The VIX, on the other hand, hardly seems to care, registering an increase of 1.08 over the last seven weeks. The same is true for the VWSI, which has treaded water in the +3 to -3 range during this period.

Last week was more of the same. The VIX dropped 2.99 (10.7%) to 25.02. The VWSI moved more significantly, from 0 to +3, but the +3 reading from the end of the week is still consistent with a neutral outlook.

As is my weekly custom, for a survey of the best in current thinking about the markets, Barry Ritholtz at The Big Picture sums up the week that was and the week that is on tap in his 3-Day-Weekend Linkfest!

In the realm of interesting market sentiment data, I continue to be most interested in the ISEE, which ended the week with several record low readings. This is normally a bullish contrarian indicator, but as I have noted here on several occasions, the divergence with the volatility indices is a bearish signal.

(Note that in the above temperature gauge, the "bullish" and "bearish" labels apply to the VIX, not to the broader markets, which are usually negatively correlated with the VIX.)

Wine pairing: For previous VWSI readings of +3, I highlighted sauvignon blancs from Cloudy Bay and the Marlborough region of New Zealand, as well as some excellent California producers whose sauvignon blanc can be had locally for $10 or less: Bogle; Chateau St. Jean (where it goes under the fumé blanc moniker); Concannon; Kenwood; and Sterling. More recently, I was impressed by a complex sauvignon blanc, with a little bit of oak, from Gary Farrell Vineyards. Their 2005 effort can be had for about $25; for my money, it knocks the socks off almost all of the chardonnays in that price range.

Finally, for an entertaining (think the mannerisms of Joe Pesci and Woody Allen blended with the enthusiasm of Jim Cramer) and informative look at sauvignon blanc, I encourage the reader to sample Gary Vaynerchuk's "Sauvignon Blanc Taste-Off" on wine library tv.

Friday, February 15, 2008

More Record Lows in the ISEE

I haven't bothered posting about the ISEE lately not because nothing of interest is happening with that index, but because the story hasn't changed. In fact, the ISEE has set new record lows in the 20 day simple moving average for the past two days and the 50 day SMA for the past three days.

The VIX may look placid, but be careful not to conclude too much from that one data point. Options buyers may not be panic-buying puts and driving up volatility readings, but their relative interest in buying calls vs. puts is much lower than it ever has been during the six years for which the ISE has published ISEE sentiment data.

As I mentioned a month ago, history suggests that the markets usually struggle after we have a lackluster VIX combined with investors who are reluctant to buy calls.

Thursday, February 14, 2008

BIDU, Calls and Time Decay

I am generally not a fan of being long any options during options expiration week, as the effort required to ‘salmon’ upstream against the relentless current of time decay (theta) makes these trades extremely challenging. Not only do you have to get the direction right, but you have to do it in a big way and in a hurry. Of course, if there is another volatility event that you have to overcome during options expiration week, that makes the task even more difficult.

Baidu (BIDU) is a perfect case in point. Earnings came out after the close last night and while the most recent quarter comfortably exceeded expectations, the company’s tepid guidance had some analysts wondering what the future revenue stream looks like.

With the conflicting numbers and multiple interpretations available, the market action has been interesting to watch. After closing at 261.09 yesterday, BIDU traded up almost 30 points in the after hours session last night, before settling back to an after hours gain of about 18 points. In pre-market the stock gradually slid down to 274, up about 13 points over Wednesday’s close. When the regular session opened, the stock fell quickly to 263, recovered sharply to trade briefly above 280, and has been in a downtrend ever since, currently trading back down to about 267.

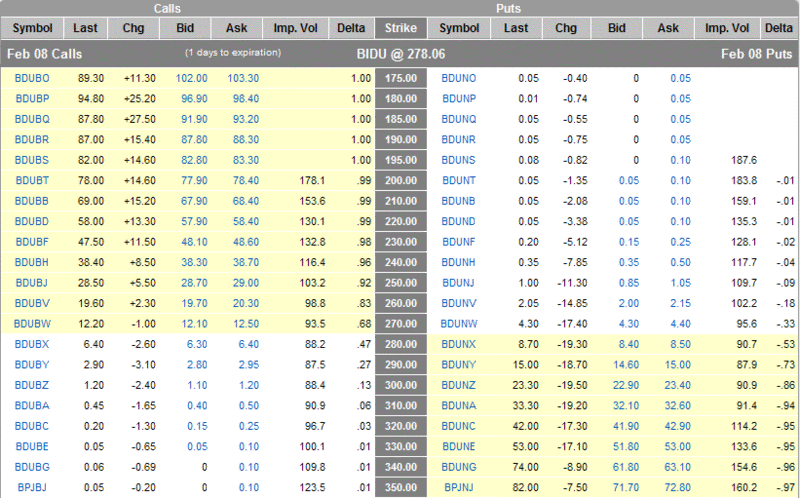
The first graphic, which comes from optionsXpress, shows how the options were behaving after about a half hour of trading, when BIDU was up 16.97 at 278.06. If you happened to be long BIDU calls at a strike of 270 or above, you were losing money, even with the stock up 6.5%.

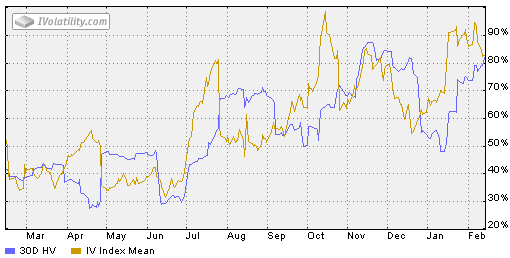
Normally, one would expect a post-earnings volatility crush, where IV contracts and all options lose their value, but as the iVolatility chart on the bottom shows, IV was not particularly high (relative to recent historical BIDU levels) coming into earnings, nor did it drop dramatically after earnings were out (see the IV numbers in the optionsXpress table.)

BIDU’s action today is an excellent illustration of what happens toward the end of the options expiration cycle, when time decay accelerates. While it is still possible to make money being long options, the percentages are with those who are on the side of time decay. If you are looking at a stock with high IV and an earnings report or other volatility event, consider that at the money options can still be losers even if you get the direction correct and have a 6.5% move in the underlying on your side.


Wednesday, February 13, 2008

VIX February Options Calendar Anomaly

Just a quick note to remind anyone who is trading VIX options that the February options expirations calendar [which is pinned at the bottom of the "VIX & Sentiment Links" in the upper right hand corner of the blog] has some unusual features that are the result of the timing of Good Friday, which falls on expiration week in March this year.

Without getting into all the details, the bottom line is that the expiration day for February's VIX options is Tuesday, February 19th, instead of the usual Wednesday. With the President’s Day holiday falling on Monday the 18th, this moves the last trading day in VIX options up to Friday, February 15th – the day after tomorrow. Note that the same expiration and last trading dates also apply to VXN and RVX options.

Anyone who wishes to dive into the details of the VIX options calendar and other related information is encouraged to brush up on the VIX options contract specifications.

NASDAQ 2315-2320

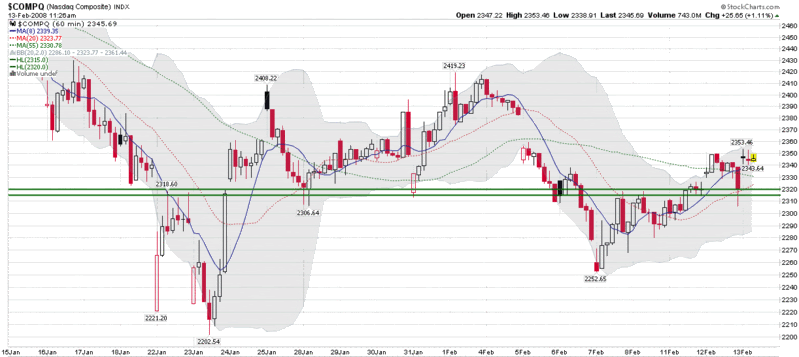
If you have been watching the NASDAQ Composite Index for the last few weeks, it is likely that you have paid close attention the area around 2315-2320.

I usually don’t talk about basic support and resistance levels in the major indices, largely because guys like TraderMike and a host of others cover those bases nicely. Given all the interest associated with whether the market has bottomed or will bottom soon, I chose to focus on 2320 in The Game Is Afoot back on January 25th. With three weeks of hindsight, this has turned out to be an even more critical level than I had expected it would be.

In the chart below, which shows 60 minute bars over the course of the past month, the 2315-2320 area has defined two important gaps and repeated instances of critical support and resistance. If today’s rally continues, it is possible that this level will not be tested going forward; however, if it does get tested again, expect the battle for 2315 to be one of the most important skirmishes that will determine whether the lows of January 22nd and 23rd turn out to be a bottom.

Tuesday, February 12, 2008

The VIX, VXV and Volatility Expectations

I am frequently asked to provide more commentary on VIX futures and the extent to which expectations for future volatility as indicated by VIX futures contrasts sharply with the cash or spot VIX. While I think this is a worthwhile exercise, I am not a big fan of the various charts that I can easily put my hands on, including this one from FutureSource.com (which can be easily edited) that compares the August 2008 VIX futures with the cash VIX. The FutureSouce.com chart in the link above, for instance, uses different Y-axis values for the futures and the cash market, making comparisons a little too murky for my taste.

It is for these reasons that I was so excited when the CBOE announced the VXV, which is analogous to the VIX except that it uses a 93 day time horizon in lieu of the 30 day time frame of the VIX. Better yet, the VXV is supported by my favorite chart service, StockCharts.com, which makes it easy to provide a wide range of customizable comparisons of the VIX and the VXV.

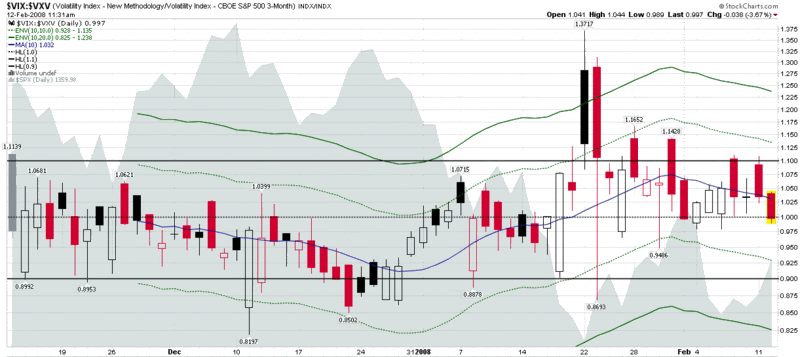
Launched three months ago, the VXV chart finally has a critical mass of data that makes it easier to identify trends. My interest, however, is not so much the VXV in a vacuum as it is compared to the VIX. Hence the VIX:VXV ratio, which is what the chart below captures. While it is still relatively early to have high confidence trading rules for this ratio, my working hypothesis continues to be that this ratio will be mean reverting around 1.00, with the best long entries (for the SPX or other long instruments) when the ratio drops below 0.90 and the best short entries when the ratio rises above 1.10.

In addition to the extreme values that the VIX:VXV ratio generates as trading signals, some of the middling values may also have interpretive value. As I type this, for instance, the ratio sits at 0.997, suggesting that there is no discernable difference between volatility expectations over the next 30 days and over a 93 day period. Said another way, today’s rally does not seem to have put the VIX in an ‘oversold’ mode, at least relative to future volatility expectations.

Monday, February 11, 2008

NASDAQ Summation Index

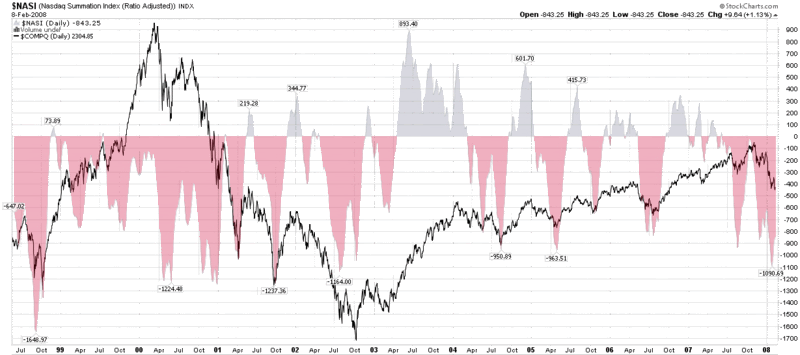
When it comes to market breadth indicators, I have particular fondness for the McClellan Summation Index, which I have discussed in this space several times in the past year. While the McClellan Summation Index draws upon NYSE advance decline data, I am actually a little bit partial to the NASDAQ variant. For those who use StockCharts.com, the ticker for the NASDAQ summation index is NASI and the NYSE/McClellan version is the NYSI.

So here is the big question: is the historically low NASI advance decline data a buying opportunity or a warning sign?

In order to best answer that question, I have included a chart below that plots NASI data going back ten years. It clearly shows that buying on any significant NASI dip (say -900 or lower) since the October 2002 bottom has been an excellent investment tactic, as was the run up to the 2000 market top. The graph also shows, however, that during the 2000-2002 bear market, this was a risky strategy that tried to capture short bounces which were brief countertrends against a falling tide. It was possible to be successful, but tight stops and/or a narrow time horizon were needed to control risk.

When all is said and done, we are back to a discussion about whether it makes sense to buy on the dips. In a well defined uptrend, there is not doubt that this is a winning strategy. In a bear market, one can still make money on the bullish countertrend, but these need to be surgical strikes. There isn’t much in the way of sideways action evident in this long-term chart, but it is safe to conclude that buying on the dips in a non-trending market – classic oscillator-based trading – is less profitable than trading with the trend, but offers more substantially opportunity than trying to trade against it.

My current reading of the NASI is that we are more likely than not to get a bounce off of current levels; if it turns out we are in a bear market, these gains will be short-lived, but if we are putting in a bottom of at least intermediate-term length, there is considerable opportunity to the upside.

WTI Boosts Portfolio A1

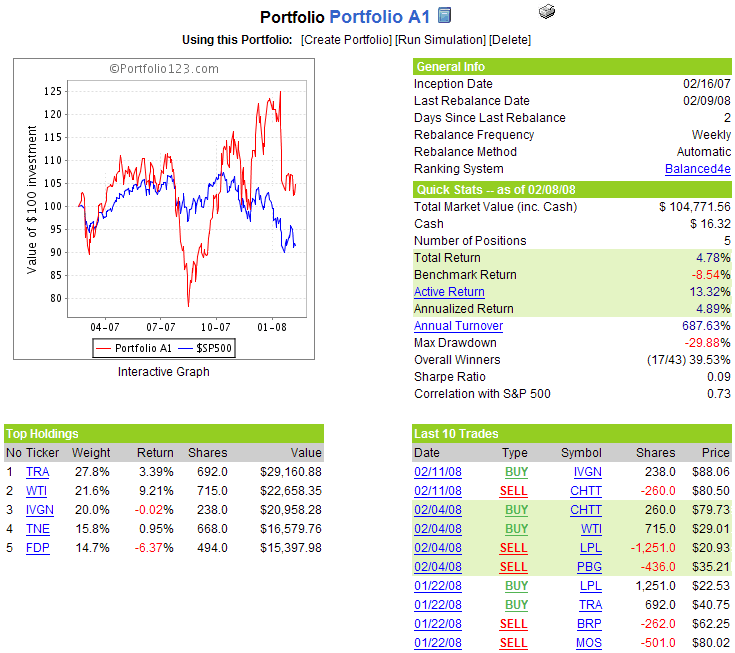
After a challenging start to the new year that resulted in a major reshuffling of the portfolio, it looks as if Portfolio A1 is now back on track with an interesting cross-section of holdings. Part of the credit for the performance turnaround should go to W&T Offshore (WTI), the oil and gas exploration and production company that gained 9.2% in the first week it was in the portfolio. A five stock portfolio is always a crap shoot of sorts, but given the current market environment and opportunities it presents, I am pleased with the current makeup of the portfolio.

After 51 weeks (since the February 16, 2007 inception), Portfolio A1 sports a cumulative performance of +4.8% vs. a -8.5% performance in the benchmark S&P 500 index over the same period.

Gone after just one week in the portfolio is Chattem (CHTT), which is being replaced by Invitrogen (IVGN), a lab testing and diagnostic company that just last week reported solid earnings and resolved some patent disputes. For those looking for more information on IVGN, a good place to start is with the conference call transcript from the February 5, 2008 conference call.

There no additional changes to the portfolio this week.

A snapshot of Portfolio A1 is as follows:

VWSI at Zero Even though VIX Jumps 16.6%

It is very unusual to see the VIX make a significant move and the VWSI to register a zero reading, particularly given the mean-reverting bias built in to the VWSI calculations. As a result, last weeks 16.6% jump in the VIX has me suspecting that the VIX may be a better barometer of market volatility in the coming week or two.

Officially, the VIX ended the week at 28.01, up 3.99 or 16.6%. While the VIX has been mostly going sideways the past three weeks, the current level is still 66% higher than the 18.47 close just seven weeks ago.

Normally, when I see the VIX jump 15% or more in one week, I start to think about selling some VIX options. With the VWSI at zero, however, there doesn’t seem to be a tradeable edge in the current situation. Furthermore, a quick glance at the VIX COT report chart shows the commercials continuing to add to long positions even as the VIX trends higher (the orange line is the ‘net commercials’ and dark line is the ‘net large traders’) – a very unusual posture for a group that generally prefers to fade the big moves. Perhaps something wicked this way comes

(Note that in the above temperature gauge, the "bullish" and "bearish" labels apply to the VIX, not to the broader markets, which are usually negatively correlated with the VIX.)

Wine pairing: For a VWSI of zero, I began 2007 by recommending some Rhone blends and later expanded the category to include any expensive blend. Over the course of the year, my two favorite inexpensive blends turned out to be the $8 Oakley Five Reds (the 2003 vintage is a blend of 41% syrah, 27% zinfandel, 22% petite sirah, 10% alicante bouschet, and 1% mourvedre from Cline Cellars); and the 2005 vintage of The Hermit Crab from D’Arenberg, a delicious $13 blend of 70% viognier and 30% marsanne.

DISCLAIMER: "VIX®" is a trademark of Chicago Board Options Exchange, Incorporated. Chicago Board Options Exchange, Incorporated is not affiliated with this website or this website's owner's or operators. CBOE assumes no responsibility for the accuracy or completeness or any other aspect of any content posted on this website by its operator or any third party. All content on this site is provided for informational and entertainment purposes only and is not intended as advice to buy or sell any securities. Stocks are difficult to trade; options are even harder. When it comes to VIX derivatives, don't fall into the trap of thinking that just because you can ride a horse, you can ride an alligator. Please do your own homework and accept full responsibility for any investment decisions you make. No content on this site can be used for commercial purposes without the prior written permission of the author. Copyright © 2007-2023 Bill Luby. All rights reserved.
 
Web Analytics