Wednesday, October 15, 2008

Excellent Summary of Financial Crisis at Freakonomics

I normally shy away from devoting a post entirely to heaping praise at one particular post out in the blogosphere, but Steven Levitt's (of Freakonomics fame) Everything You Need to Know About the Financial Crisis: A Guest Post by Diamond and Kashyap is required reading for anyone who wants an excellent summary of where we are, how we got here, and what might happen going forward

Could Today Be a Higher Low?

Don't be surprised if that turns out to be the case...

Implied Volatility Over 150 in EWZ, the Brazil ETF

Truth be told, I could pick a ticker at random and have a compelling chart of implied volatility. Some, of course, are more compelling than others.

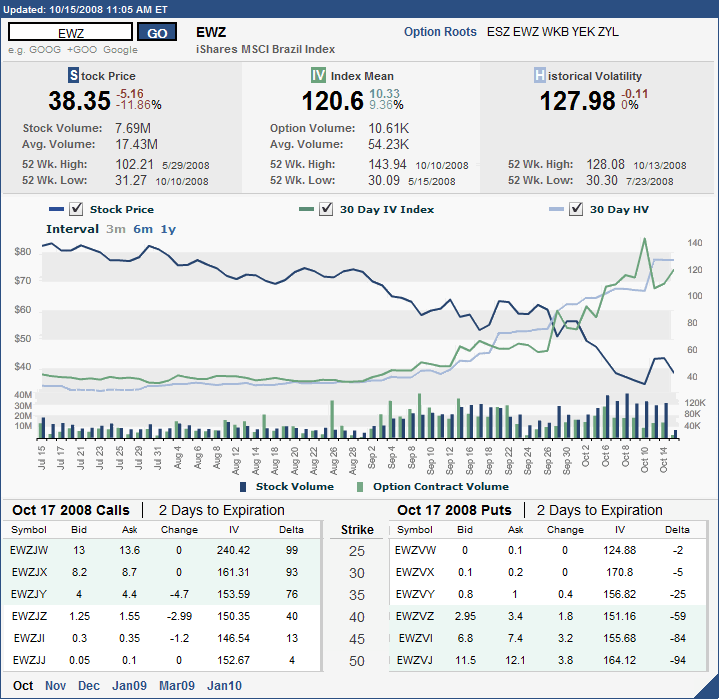
Take EWZ, for instance, the Brazil ETF. This resource-rich country has seen its ETF lose more than half of its value over the past year, coupled with a dramatic rise in volatility over the course of the past month.

In the chart below, courtesy of the International Securities Exchange, one can discern that implied volatility and historical volatility had been hovering in the range of 40 even as the ETF trended down during the summer. Starting in early September, the increase in volume in both the ETF and the options hints than an even wilder ride is coming.

In fact, implied volatility spiked from 40 to over 140, with historical volatility making similar gains. At the moment, both mean IV and HV are over 120, with both the near the money calls and puts expiring at the end of the week showing implied volatility readings in excess of 150. This is country risk at extreme levels.

Those with a directional preference who are looking to limit risk in high volatility environments may wish to look at bear call spreads for a short bias and bull put spreads for a long bias.
[source: International Securities Exchange]

[Disclosure: long EWZ at time of writing]

Tuesday, October 14, 2008

Yesterday’s VIX Drop Is Fifth Largest Ever in Percentage Terms

Yesterday the VIX registered its largest one day point drop in history, falling 14.96 points, but what does that mean?

If history is any guide, the drop in the VIX may not be particularly meaningful. The previous largest drop in the VIX in absolute numbers dates back to September 1, 1998. On that day, there was a brief lull in the Long-Term Capital Management crisis and the VIX pulled back from 44.28 to 36.48. Just three days later, however, the VIX was back above 44.

In percentage terms, yesterday’s 21.4% drop in the VIX is the fifth largest one day drop in the VIX in 19 years.

I wrote about previous instances of 20% drops in the VIX a little over a year ago in On the Rarity of a 20% One Day Drop in the VIX. Since that post, the VIX dropped 22.5% on 11/13/07 and exactly 20% on 3/18/08.

In the six previous instances in which the VIX has dropped at least 20%, the SPX has generally underperformed the historical averages slightly going forward.

Maybe someday I should publish the Guinness Book of Volatility Records…

Monday, October 13, 2008

DJIA +573 Today; VIX at 61.43

Someday this will look like a very strange headline, but right now it makes perfect sense...

Institutional Interest High in These Nine Large Caps

Stocks of all sizes and shapes are trading up today, but which ones will continue to do well if the market holds up?
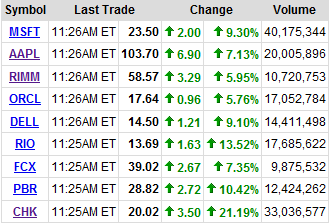
In the graphic to the right (courtesy of Yahoo) I highlight nine large cap stocks that appear to be the biggest targets of institutional interest not just today, but when the markets moved up in spurts last week too. Those that made the cut did so on the basis of several price factors and several volume factors. The list consists of five technology names (MSFT, AAPL, RIMM, ORCL, and DELL), two mining/metals stocks (RIO, FCX), and two energy stocks (PBR and CHK). Interestingly, two of the nine companies are based in Brazil.

At the very moment at least, these nine companies look to be at the top of the heap: quality stocks at attractive valuations, with considerable institutional interest. I would expect these names to continue to lead the way in subsequent bull moves.

Note that one company on this list may be somewhat of a special case. Chesapeake Energy (CHK) CEO Aubrey McClendon was forced to sell “substantially all” of his 33 million shares last week to meet a margin call. With that forced selling completed, the stock is bouncing back today.

Friday, October 10, 2008

Two More VIX Records

Once again, the VIX is in the record books, with two new highs:

  • new closing high: 69.95
  • new intra-day high: 76.94

Of course, today is also the first time the VIX traded over 70.

In other volatility index news, the VXO (CBOE S&P 100 Volatility Index) closed at 86.14, almost exactly half of the all-time record high of 172.79 from October 20, 1987. The VXO had an intra-day high of 103.18, marking the first time the 'original VIX' has been over the 100 mark since 1987.

VIX November Futures

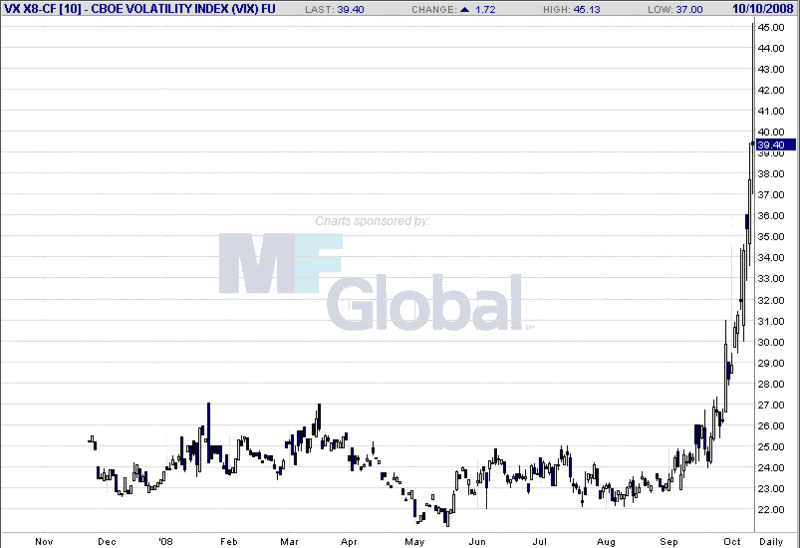
Per reader request, a chart of the VIX November futures (X8), courtesy of Futuresource.com:

[source: FutureSource]

VIX to 70.56 as Markets Start to Snap Back

How long this snap back will last remains to be seen, but there is a strong possibility that we just made an intermediate bottom

OHFDEX One Year Later

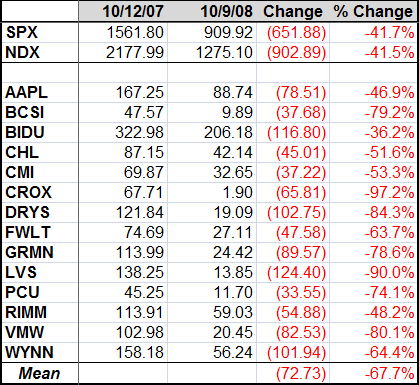
One year ago, in “From Overripe to Vulnerable?” I introduced something I called the OHFdex or listing of Overripe High Fliers, along with 14 CandleGlance charts from StockCharts.com for the highest fliers.

Needless to say, the picture one year later is an ugly one.

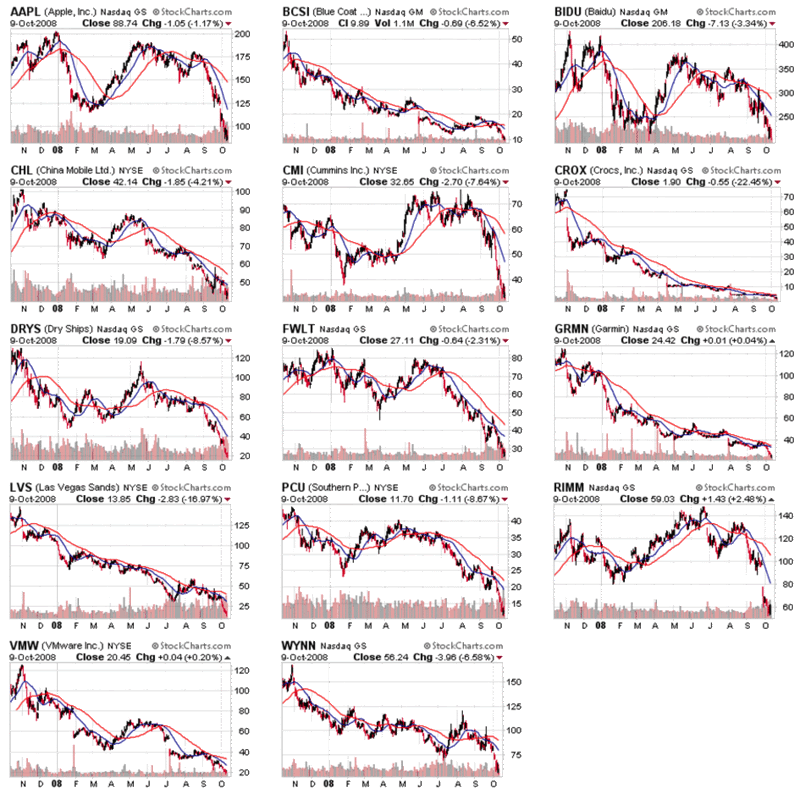
Not only were these stocks overripe and vulnerable a year ago, but they were ripe for decimation. CROCS (CROX) is down over 97% in a year, Las Vegas Sands (LVS) is down 90%, and both DryShips (DRYS) and VMware (VMW) are down more than 80%. All told, 11 of the 14 former high fliers are down 50% or more. The mean decline was 67.7% and the median decline was 69.3%. The best performer among the group was Baidu (BIDU), the Chinese search engine company, which has lost 36% while the Chinese markets have fallen 57%.

I have also included one year charts (once again courtesy of StockCharts.com) for all 14 members of the OHFdex below, with a 20 day SMA in blue and a 50 day SMA in red:

[source: StockCharts]

Sifting among the rubble of today’s meltdown, it looks as if it is about time to create a new list of oversold stocks that can prosper over the course of the next year.

Thursday, October 9, 2008

New Record Close for Volatility Indices


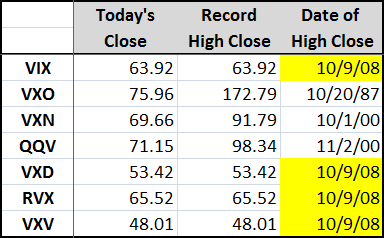
Today’s dramatic last hour selloff resulted in new record high closes in four of the seven major U.S. volatility indices, including the VIX, which exceeded 60 for the first time and established a new record close of 63.92. In addition to the VIX, the VXD (CBOE DJIA Volatility Index) and the RVX (CBOE Russell 2000 Volatility Index) also set new records.

Note that these volatility indices have different life spans and data histories, so the comparisons of all-time record highs across indices are not always particularly relevant. For more information on all of the volatility indices, try Overview of U.S. Volatility Indices.

Feels Like Capitulation to Me

Not that it cannot get worse, just the I think we stop here for now...

VIX October 80 Calls Quoted 0.40-0.55

These are a new contract as of today and already have a volume of 1320...

VIX Hits 60

No sign of capitulation yet...

Capitulation Leg?

The sharp move down just after 3:00 p.m. EDT has some elements of a capitulation move.

DISCLAIMER: "VIX®" is a trademark of Chicago Board Options Exchange, Incorporated. Chicago Board Options Exchange, Incorporated is not affiliated with this website or this website's owner's or operators. CBOE assumes no responsibility for the accuracy or completeness or any other aspect of any content posted on this website by its operator or any third party. All content on this site is provided for informational and entertainment purposes only and is not intended as advice to buy or sell any securities. Stocks are difficult to trade; options are even harder. When it comes to VIX derivatives, don't fall into the trap of thinking that just because you can ride a horse, you can ride an alligator. Please do your own homework and accept full responsibility for any investment decisions you make. No content on this site can be used for commercial purposes without the prior written permission of the author. Copyright © 2007-2023 Bill Luby. All rights reserved.
 
Web Analytics