Monday, January 28, 2008

Portfolio A1 Bounces Back

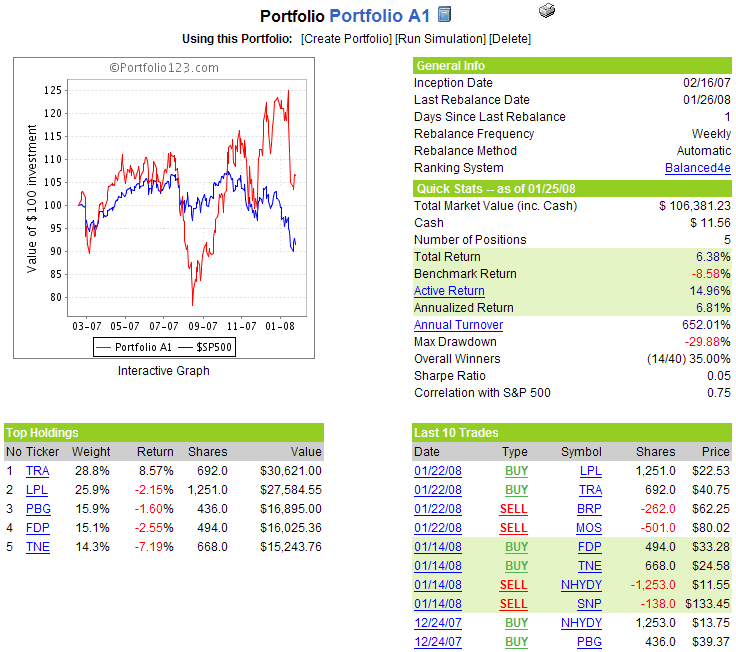
While it was not a big bounce, the fact that Portfolio A1 bounced 1% more than the benchmark S&P 500 index did last week has to be considered a good sign. After 49 weeks, the portfolio’s 6.4% gain still compares quite favorably to the 8.6% loss in the SPX over the same period.

New addition Terra Industries (TRA) led the way with an 8.6% gain for the week, after taking the fertilizer baton from previous portfolio anchor, The Mosaic Company (MOS).

The 2008 year to date numbers (through Friday) show that Portfolio A1 has fallen faster than the SPX – -12.8% vs. -8.7% – with the superior cumulative performance numbers for the portfolio largely a reflection of a superb fourth quarter in 2007. Some may see this as a possible anomaly, but this portfolio is set up to ‘fish for whales,’ a theme I will expound upon in the future.

There no changes to the portfolio this week.

A snapshot of Portfolio A1 is as follows:

VWSI at Zero After VIX Hits 5 ½ Year High

You know it’s an interesting market when the VIX hits a 5 ½ year high (37.57) on Tuesday, while the VWSI actually manages to end the week down a point at zero.

Part of the reason for these statistical oddities is that the VIX fell 23% from Tuesday’s high to Friday’s close, resulting in a weekly gain of ‘only’ 1.9 (7%.) The 29.08 close is the second highest end of week close since March 2003, behind only the 29.99 close in the middle of August 2007.

With a 23% move already accounted for, the VWSI has a neutral volatility outlook going into the week, apparently viewing last week’s volatility snap back move as already having fully discounted future mean reversion opportunities.

As is my weekly custom, for a survey of the best in current thinking about the markets, Barry Ritholtz at The Big Picture sums up the crazy week that was and the week that lies ahead in his End of January Linkfest.

As we wait for the Fed to announce their next move(s), this might be a good time to cut back on trading an brush up on some reading. In case you missed it, I would start with Roger Lowenstein’s [author of When Genius Failed: The Rise and Fall of Long-Term Capital Management] The Education of Ben Bernanke from last Sunday’s New York Times. Three books I have recently enjoyed that are particularly pertinent to current markets are:

Also, for links to Fed speeches, charts of market action on Fed Days, etc., don’t forget my collection of Fed Links.

(Note that in the above temperature gauge, the "bullish" and "bearish" labels apply to the VIX, not to the broader markets, which are usually negatively correlated with the VIX.)

Wine pairing: For a VWSI of zero, I began 2007 by recommending some Rhone blends and later expanded the category to include any expensive blend. Over the course of the year, my two favorite inexpensive blends turned out to be the $8 Oakley Five Reds (the 2003 vintage is a blend of 41% syrah, 27% zinfandel, 22% petite sirah, 10% alicante bouschet, and 1% mourvedre from Cline Cellars); and the 2005 vintage of The Hermit Crab from D’Arenberg, a delicious $13 blend of 70% viognier and 30% marsanne.
Friday, January 25, 2008

The Game Is Afoot

Today’s bearish reversal is the first minor skirmish following the recent selloff and attempt at a bottom.
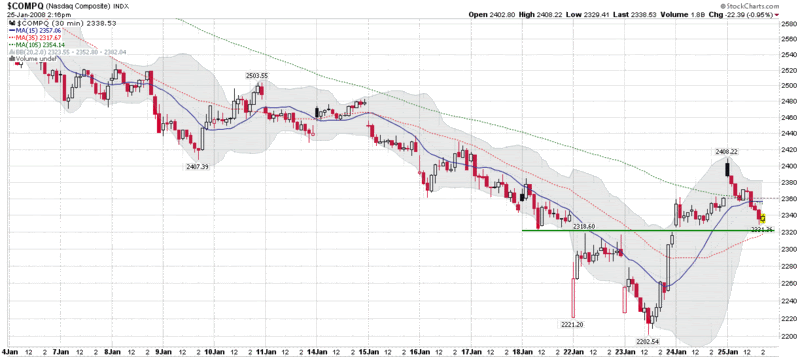
In looking at a chart of NASDAQ composite, the obvious ultimate support level is the 2202 bottom that was put in on Wednesday. Almost as important, however, is the green line at about 2320-2325 that I have added to the 30 minute chart below. For the moment at least, 2320 is the critical line in the sand. This line highlights important gaps on Wednesday and Thursday that served as resistance on both days, as the bottom was forming. Now the 2320-2325 area appears to have flipped from resistance to support in the face of today’s downturn.

It is way too early to draw any conclusions about the bottom earlier in the week, but there is a possibility that we are seeing the first higher low, which would move the battlefield to the 2220-2410 arena – the full extent of today’s range. About the only thing I can say with confidence at this point is that the game is afoot. How well the bulls defend 2320 should go a long way to determining whether this week’s action will turn out to be an important bottom. If 2320 falls, I suspect it will be very difficult to rally sufficient support to make 2202 hold.

Thursday, January 24, 2008

Reversal Bar Analysis at Quantifiable Edges

I have been impressed by the breadth of top notch analytical thinking across the investment blog world in the past few weeks and have found many insights of note from some of the stalwarts on my blogroll. For the moment, however, I want to highlight one new blog, Quantifiable Edges, authored by Rob Hanna, that has particularly impressed me with some timely and thought provoking analysis.

Rob just happens to be in the midst of publishing some excellent work he has been doing on reversal bars – a subject that should be top of mind for all traders, given the recent market action. I encourage readers to click through and have a look: Quantifiable Edges on reversal bars

MBI, Bond Insurers, and Volatility

One of the more interesting – and important – subplots to keep an eye on during the current market difficulties is that of the bond insurers. The two most prominent of these bond insurers, MBIA (MBI) and Ambac (ABK), are in the news today with reports that the New York Insurance Superintendent is trying to arrange a capital infusion from the likes of Goldman Sachs (GS), Merrill Lynch (MER), JPMorgan (JPM), Citigroup (C), and Wachovia (WB). Presumably, the Fed is doing some arm twisting and offering some financial incentives behind the scenes, as a failure to resolve the problems with the bond insurers would likely trigger systemic havoc and involve a long and expensive list of dominoes in the process.

Eric Dinallo, the New York Insurance Superintendent, was quoted earlier today as saying that while a rapid resolution is essential, ironing out the details of a bailout may take awhile. “It is important to resolve issues related to the bond insurers as soon as possible,” Dinallo noted, while cautioning “these are complicated issues involving a number of parties and any effective plan will take some time to finalize.”

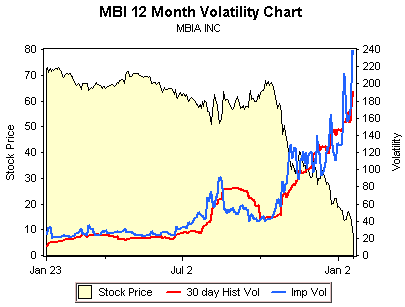
While most investors should be thinking about the bond insurer issue in terms of its impact on the broader markets, there are some interesting plays on bond issuers themselves. As reported in 24/7 Wall Street, Goldman Sachs laid out some potential valuations under three different scenarios, ranging from the bond insurers’ being unable to raise enough capital to mollify the rating agencies to a situation where the capital raised enables the bond insurers to continue to operate as they had in a pre-crisis mode. Looking just at MBI, the valuation spread ranges from $6 to $48.

Investments don’t get much more speculative than this, as the chart from optionsXpress above shows. For the record, all February puts now carry an implied volatility of more than 200. While I am not going to recommend a specific trade here, there are some fascinating options spreads and ratio spreads to look at for those who believe that the Goldman scenarios and numbers are in the ballpark.

Wednesday, January 23, 2008

NDX Fails Briefly, Other Indices Hold Bottoms

Bottoms are an interesting species. They are almost impossible to call in advance and surprisingly difficult to identify with a little hindsight. Typically, by the time you have enough hindsight to say, “Hey that was a bottom back there!” you have already missed a good portion of the move up from that point.

A number of indicators can help raise the probability of calling a bottom, the VIX among them, but we are still in the meteorological realm in terms of accuracy – and very much in the pre-Doppler era at that.

Most students of market bottoms agree that evidence of widespread capitulation is the best way to identify a market bottom. The reasoning is essentially that it is ‘better’ to have one day of extreme investor panic than a number of days in which the cumulative losses add up to one big drop while the psyche of the investor is able to digest the grief on the installment.

According to the reasoning above, yesterday had some elements of extreme investor panic at the open, but the ease with which the markets rallied from that point suggest that there may not have been enough panic or pain to account for a traditional capitulation bottom. This morning’s open was also relatively low in terms of panic and pain – at least on the capitulation scale – so there will be many who will wait for another strong retest of yesterday’s lows (and of investor fortitude) before committing to new bullish positions.

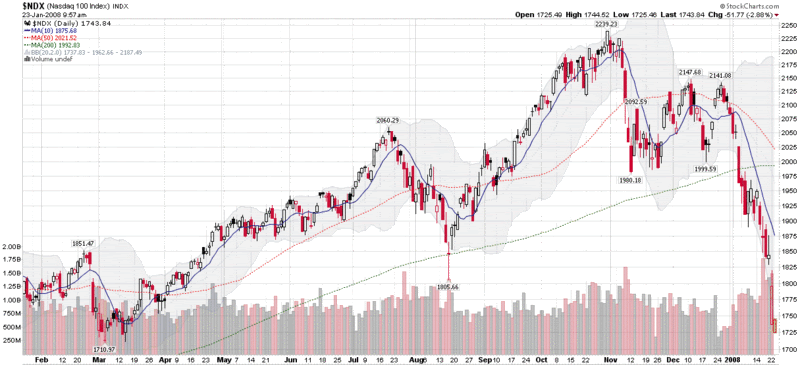
It is worth noting that one major index had yesterday’s low breached this morning: the NASDAQ-100 (NDX). Thanks to AAPL’s weak guidance yesterday after the bell, the stock opened dramatically lower and pulled the NDX down with it. The NDX has since recovered, but it and AAPL should be watched closely, as their support levels will likely be tested before those of the other more widely followed indices.

Tuesday, January 22, 2008

Brunhilde Day Today?

Today could turn out to be one of those days that imprints the value of the VIX deeply into the psyche of many traders.
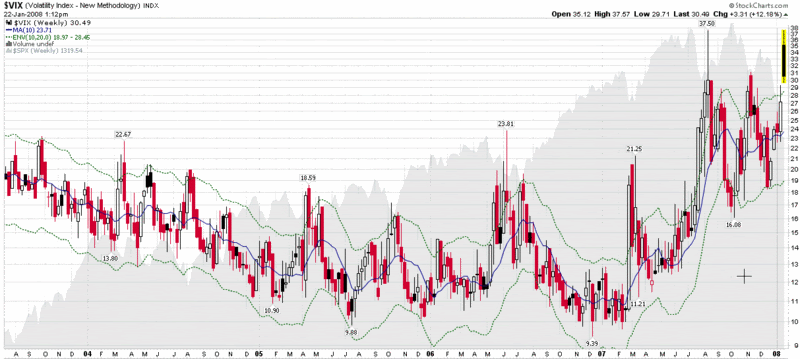

While I have gone out of my way to suggest that the markets do not have to see a VIX spike in order to put in a bottom, it appears that following this morning’s surge in the VIX to 37.57 (the highest reading since October 2002) many buyers felt comfortable starting to nibble. Now with the markets inching back toward even for the day, the likelihood of a high volume reversal day signaling a market bottom is increasing dramatically.

While I have done some nibbling of my own, I would not be surprised to see at least one test of the lows of the morning and would hold off on calling a bottom until we see more evidence of higher lows and higher highs.

On the other hand, if today turns out to be a bottom, you can bet that that next time we have a major selloff, traders will be watching the VIX even more intently to determine when it signals that bottom. If the VIX was important before today, it is about to become even more important going forward, when traders eagerly watch to see when Brunhilde is going to sing.

Portfolio A1 Falls as Mosaic’s Run Comes to an End

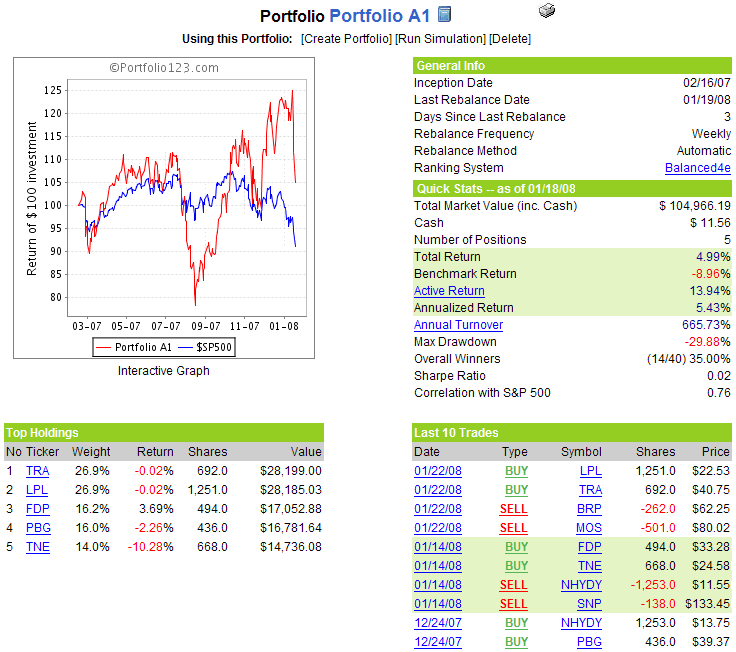
It was fun while it lasted, but it had to come to an end eventually. The Mosaic Company (MOS), which had run up an eye opening 176% in the first five months it was in Portfolio A1, is now gone from stable, victim of a rule that automatically culls any stock that falls 20% from the high recorded during the holding period. Also shown the door as a result of a 20% drop is Brazil Telecom Participacoes (BRP).

Replacing MOS and BRP are LG Philips LCD Co. (LPL) and Terra Industries (TRA). LG Philips LCD Co. is a Seoul-based $16 billion joint venture in the display business between two global giants, LG Electronics and Royal Philips Electronics. TRA, a nitrogen fertilizer company, demonstrates how some portfolio ‘rules’ can backfire, as this company is a direct competitor of Mosaic in the fertilizer business and at only 10% of Mosaic’s market capitalization is actually a much riskier play in this sector. Nevertheless, the stock ranker has spoken and TRA should do well if this week turns out to be a bottom. As far as the wisdom of holding an LCD manufacturer at a point where consumer demand appears to be drying up, I am skeptical, but this remains a 100% mechanical portfolio, where my perspective does not matter.

After falling 11.4% last week, Portfolio A1 is still sporting a 5% gain since the February 16, 2007 inception, considerably better than the 9% loss in the benchmark S&P 500 index during the same period.

There no other changes to the portfolio this week.

A snapshot of the Portfolio A1 is as follows:

VWSI at +1 as Historic Meltdown Approaches

In light of the oncoming freight train that is today’s session, it seems somewhat academic to recount the action in the VIX last week. For the record, last week the VIX gained 3.50 points (14.8%) to close out the week at 27.18. The VWSI rose one tick to +1.

As is my weekly custom, for a survey of the best in current thinking about the markets, Barry Ritholtz at The Big Picture sums up the week that was and takes a stab at what will likely be a historic trading week in his 3 Day Weekend Linkfest: Review/Preview (authored Sunday evening, so it doesn’t include the thinking coming out of yesterday’s carnage.)

I am estimating that the VIX will open between 35 and 36, then move higher from that level as the rush to the exits precludes the need for anyone to yell “Fire!” A VIX north of 40 would not surprise me, nor would a short-term bottom forming sometime later in the week.

(Note that in the above temperature gauge, the "bullish" and "bearish" labels apply to the VIX, not to the broader markets, which are usually negatively correlated with the VIX.)

Wine pairing: For a VWSI of +1, I recommend a guwurztraminer. For the record, my favorite American version of this wine is the dry gewurztraminer from Londer Vineyards of Anderson Valley. I have not yet sampled the 2006 vintage, but the 2005 was an unforgettable wine that I would love to see in a blind tasting against some of the top Alsatian competition.

In my previous roundup of California gewurztraminer, I suggested Navarro and Harvest Moon. For some of my top selections from Alsace, check out Trimbach; Hugel; and Domaine Weinbach. You can also check out the top-rated gewurztraminers in the 2007 San Francisco Chronicle Wine Competition.

Friday, January 18, 2008

Will a 29.30 VIX Placate the Crowd?

Until the past few days, I did not realize how many investors – or at least pundits – are of the opinion that the market cannot put in a bottom until the VIX spikes. True, the classic market bottom includes a dramatic drop, a spike in volume, and a spike in investor fear to purge even the most stubborn investors of their losing long positions. As I have stated previously, however, I am comfortable in my belief that a VIX spike strongly increases the likelihood of a bottom, but should not be considered a requirement, per se.

Consider, for a moment, that a VIX spike capitulation bottom may be one of those investment phenomena in which one’s individual assessment doesn’t matter. If enough people believe that A is a precondition for B and trade accordingly, just about any A can become a self-fulfilling prophecy.

Back to the VIX spike, we just hit 29.30 on the VIX a moment ago. While some were calling for the VIX to cross 30 to signal a market bottom, it is possible that the current level may be considered close enough to draw in those looking to play the oversold bounce card.

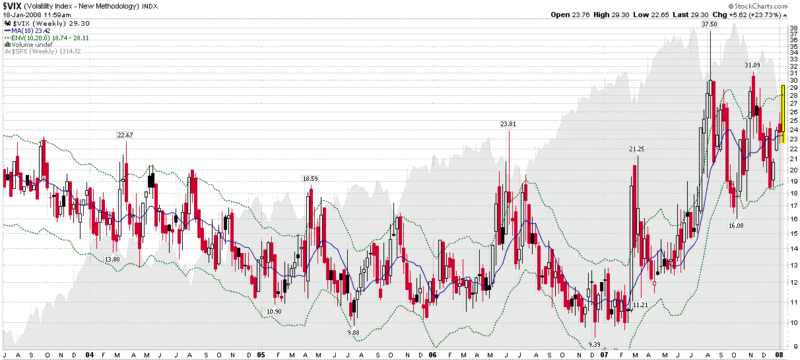
I have chosen to include a weekly chart of the VIX as a framework for evaluating the current VIX spike. It shows that a 20% deviation from the 10 week SMA has proven to be a fairly reliable timing device in the past. It remains to be seen whether that is the case today, but I am not anticipating a VIX spike over 30 between now and the next Fed meeting.

Thursday, January 17, 2008

Bernanke Prepared Remarks Sink ISEE to Historic Lows

The ISEE is at historic lows with Ben Bernanke 1 1/2 hours into his testimony before the House Budget Committee.

Between 9:50 and 10:10 a.m. EST, approximately 290,000 new put positions were opened in individual equities on the ISEE. This is in sharp contrast to the meager 34,000 or so new call positions that were initiated during the same period.

Given that a copy of Bernanke's prepared remarks we distributed at approximately 10:00, the mostly likely conclusion is that some of the larger players are voting with their feet that the Fed's too little too late approach continues to offer a significant downside opportunity for those who are short the market.

At 11:30 a.m., the ISEE has climbed to 37, but with such a large number of puts already up on the scoreboard, there is a good chance that today will see a new single day closing low for the ISEE.

Wednesday, January 16, 2008

Volatility RIP?

I have talked rather extensively about the surprising lack of volatility in the markets during the past month or so, particularly given the sharpness of the current downturn and the preponderance of gloom and doom news out there. For a little while, at least, it was possible to ignore this phenomenon and chalk it up to “calendar reversion.” Now that the holiday season is behind us, this explanation no long holds water and it seems everyone wants to know why the VIX just sits there in the low to mid-20s.

For those interested in the evolution of my thinking on this subject, I encourage your to consider reading Not a Lot of Fear or Volatility Lately (11/27/07); No Fear (12/19/07); The Incredible Shrinking VIX (12/21/07); VIX Shrinkage Continues… (12/24/07); The Low Fear Selloff (1/4/08); and VWSI at Zero as VIX Meanders (1/14/08).

The bottom line is that I cannot explain why the volatility indices appear to be relatively indifferent to what many think is the beginning of a nasty bear market. Of course, this relative complacency would be possible only if investors as a whole were not worried about a bear market – and when was the last time that investors failed to panic when the markets turned down sharply?

While I have no answers, per se, I do have a few working hypotheses that I tweak from time to time, in no particular order:

  1. increased use of inverse and double inverse ETFs (i.e., QID) for hedging/speculation

  2. the expectation of a forthcoming emergency rate cut limiting upside potential for puts

  3. the possibility that there has been so much advance warning about a potential market meltdown that those who have wanted to protect their portfolio and/or speculate on a downside move have had ample time to do so, at their leisure

  4. a vicious cycle in which the less the VIX moves, the less valuable (reliable) it is as a hedge (or highly leveraged hedge)

If and when I can come up with a better answer to this question, I will cut in with a live feed from Volatility Central…

Tuesday, January 15, 2008

When Volatility and Put to Call Activity Diverges

A reader asked whether I think tracking the ratio of the VIX to the ISEE has any value in terms of market timing.
I track indicators that sum relative volatility and put to call activity as well as a couple that examine the ratio of volatility to put to call action. For the most part, these two categories of sentiment indicators tend to confirm each other. Further, when volatility and put to call numbers signal the same extreme sentiment across both dimensions at the same time – as is usually the case – this dramatically increases the expected value of a number of contrarian setups.

Strong divergences between volatility and put to call activity are relatively rare. I did blog about this type of divergence at the end of May 2007, just before the VIX started upward on a path that would see it triple in less than three months. For the record, my conclusion at that time, which continues to be supported by the data I collect, is that “high readings of volatility relative to put to call data are generally bullish for the broad markets while high readings of put to call data relative to volatility are generally bearish for the broad markets.”

In looking at the ISEE numbers, keep in mind that this is a call to put ratio, so that if one wishes to compare the VIX to the ISEE, it is best to invert one of the numbers before putting them under a microscope and studying their Brownian motion

Monday, January 14, 2008

Checking for Atheists

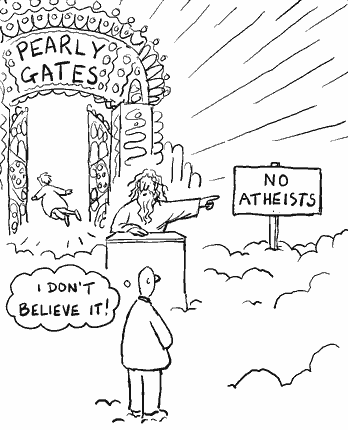
One of the things I like to do when I see the markets bounce is what I call my “atheist check.” Essentially, I take a look at the current and recent numbers for the ISEE to see if there are many believers who are flocking to buy call options. The lower the number, the more atheists there are that are still out there (or ‘undecideds’ if you prefer the political metaphor to the religious one), and therefore the larger number of potential converts available. Contrarians love potential converts, as they are the future fuel for subsequent bull legs. Generally, when I see an ISEE number (they use a call to put ratio, not a put to call ratio like the CBOE does) of 120 or below, I consider this to be a bullish signal. An ISEE of under 100, which signifies more people opening new put positions than call positions, is very bullish.

As a rule, an ISEE of under 100 is relatively rare, particularly over extended periods. What I find noteworthy about the current market is that the ISEE has closed below 100 for five of the past six days and at 92 as of 12:50 EST today, is on target to make that six of seven. The only other time that the ISEE has registered six of seven sub-100 closes since the exchange began keeping records in October 2002 is in August 2007, at the very bottom of the selloff caused by the first iteration of a subprime panic.

As far as I am concerned, the current ISEE data is almost as compelling as the 37.50 VIX spike we had in August. While the VIX demonstrates how fearful the atheists are, the ISEE reveals how many of them are out there and reminds me of one of my favorite quotes, which comes from John Bender and appears in Jack Schwager’s Stock Market Wizards, “It's not the current opinion of the stock that matters, but rather the potential change in the opinion.”

Portfolio A1 Makes Big Bet on Brazilian Telecoms to Start Year

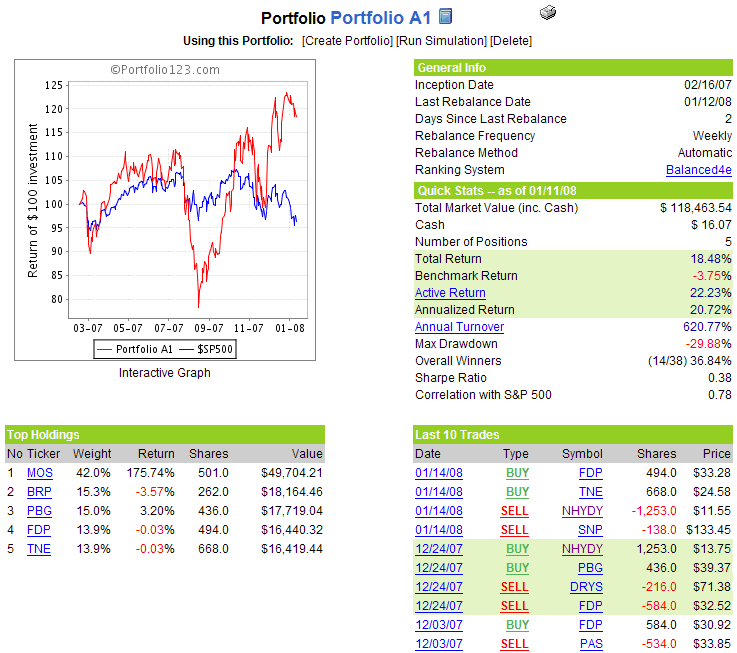
For the first time in awhile, Portfolio A1 gave back some ground to the benchmark S&P 500 index last week. Even with last week’s sub-par performance, since the February 16, 2007 inception, Portfolio A1 now has a cumulative gain of 20.7%, compared to a 3.7% loss for the SPX.

After falling 7% last week, Sinopec, a.k.a. China Petroleum & Chemical Corp (SNP) has been dropped from the portfolio, victim of a rule whereby a position is automatically closed once it falls 20% from its high during the ownership period. Also dropped were Norwegian energy and aluminum giant Norsk Hydro (NHYDY), but in this instance as a result of a declining rank from the stock ranking system. The ranking system partly reflects several technical factors and picked up on the fact that NHYDY’s stock has also struggled and is down about 17% for the first two weeks of 2008.

Replacing SNP and NHYDY in the portfolio are returnee Fresh Del Monte Produce (FDP) and a second Brazilian telecom company: Tele Norte Leste Participacoes (TNE), an integrated fixed line and mobile telecom provider with a $9.5 billion market cap. TNE joins long-time favorite BRP to give Portfolio A1 an unusual mix of 2/5 Brazilian telecoms in this five-legged portfolio. By design a focused five stock portfolio is intended to make significant bets in specific sectors and regions, but it is unusual to find this type of concentration in the portfolio, which uses a maximum sector weighting of 30% to place sector limits on all new purchases. The reason there are currently two telecom companies in the portfolio is that Mosaic (MOS) has had such a strong run (up 175.7%) that it now comprises 42% of the portfolio, so that it is possible for the other four holdings to split the remaining 58% with two companies in one sector that do not total to 30%.

Note that the portfolio has no provision for limiting the concentration of holdings by country or region.

There no other changes to the portfolio this week.

A snapshot of Portfolio A1 is as follows:

DISCLAIMER: "VIX®" is a trademark of Chicago Board Options Exchange, Incorporated. Chicago Board Options Exchange, Incorporated is not affiliated with this website or this website's owner's or operators. CBOE assumes no responsibility for the accuracy or completeness or any other aspect of any content posted on this website by its operator or any third party. All content on this site is provided for informational and entertainment purposes only and is not intended as advice to buy or sell any securities. Stocks are difficult to trade; options are even harder. When it comes to VIX derivatives, don't fall into the trap of thinking that just because you can ride a horse, you can ride an alligator. Please do your own homework and accept full responsibility for any investment decisions you make. No content on this site can be used for commercial purposes without the prior written permission of the author. Copyright © 2007-2023 Bill Luby. All rights reserved.
 
Web Analytics