Showing posts sorted by relevance for query subside. Sort by date Show all posts

Thursday, February 8, 2007

Bird Flu Stocks and Volatility

Confirmation of bird flu at a UK turkey farm over the weekend put bird flu stocks back in the spotlight once again. Over the past two years, most of us have become largely desensitized to the possibility of a widespread bird flu outbreak, as each incident has spawned a less and less strident media frenzy. In a sense, the same soft of desensitization has set in over the past year or two with bird flu, terrorism, $100/bbl. oil, Iraq/Iran, North Korea, etc. The media has a field day for awhile, but as the panic level subsides for a second or third time, the public sees these as more cry wolf exercises and makes a mental note to ignore future scare tactics and, in many cases, completely tune out the entire issue.

Is this why the VIX has now made 33 consecutive new lows for the 100 day SMA? Perhaps it is not so much complacency that has set in as mass desensitization.

Back to bird flu stocks. Their price movement has a strong fear component in them and as such, they are part of the VIX taxonomy of fear (which I will someday formalize as the VIXdex.) It should come as no surprise, then, that bird flu stocks have characteristics that are similar to that of the VIX. Specifically, they tend to spike up sharply, then subside over time, with patterns of 1 and 3-5 day spikes being relatively common. Some of this can be seen in the BCRX daily chart, where the Williams %R and CCI are showing that four days into the move up, we have a good shorting opportunity:

NVAX, AVII and GNBT are among my favorite of the pure play bird flu vaccine makers. If you have tested systems for trading the VIX, consider that the same tactics may work as well or better with bird flu stocks, with an opportunity to trade the underlying and with lower implied volatility for the options:


Tuesday, January 30, 2007

What My Dog Can Tell Us About Volatility

I am fortunate that my dog, Logan, is a well-adjusted, happy-go-lucky, 1 ½-year-old canine. To put things in perspective, his idea of a bad day in the market is any time we come home from the grocery store without cheese.

It turns out, however, that he is a walking (or running) volatility laboratory. A typical example of this is the occasional distant noise that just barely penetrates his perceptual radar, particularly on those quiet evenings when he is napping contentedly with the family. Upon hearing the noise, Logan’s altertness instantly spikes, he lets out an involuntary woof, then carefully tunes his ears to their most sensitive setting, seeking any information that will help identify the source of the noise. Usually there are no other disturbances to follow and the noise is catalogued and soon forgotten. His alertness level slowly subsides over the next 10-15 minutes or so and he goes back to napping, a little more fitfully this time and just a little bit on edge.

Things get a little more interesting when another noise surfaces shortly after the first one. What could once be dismissed as the wind, the house settling or some such insignificant event now must be treated as a threat – and just to be safe, a threat of the highest order. Now the appropriate response is a series of barks, nervous glances in the direction of the other members of the pack, brief pacing around, and a rushing off in the direction of the noise to investigate, with a flurry of barks meant to sound more menacing than the source of the noise. Who or what is it? How much harm can they cause? How grave is the threat?

It is the second noise – and any subsequent noises – that creates the equivalent of the Homeland Security red alert and triggers a response similar to what I call “echo volatility” in the markets. Once the elevated level of alertness has been established, it takes a long period of relative serenity for it to subside. On the other hand, when on red alert, any additional noises – big or small – will be magnified and regarded with the utmost caution.

In some respects, my dog is a lot like your typical investor and once he hears two or three threatening noises in a short time frame, it is a good bet that the second leg of a volatility spike is just around the corner.

Monday, January 22, 2007

On the Nature of Fear

Fear is a strange animal. It is easy to unleash, yet hard to put back in a cage. It spikes up, but rather than spiking down, it tends to slowly subside over time.

Why is this the case?

In the stock market, there are many factors that may spook investors. In the future I am considering trying to construct a formal Taxonomy of Fear, but for now, let me offer some examples. In the global political arena there are fears that range from terrorism, nuclear proliferation, Middle East tension, and a war in Iraq that could spiral out of control, to the spread of socialism in South America, China playing hardball with the renminbi, Russia throwing their weight around with energy and natural resources, etc. On the macroenomic front, is it inflation or deflation we should be more concerned about? Throw in the possibility of a recession, productivity declines and a hiccough in the job creation engine and there is the potential for a stagflation stew. Really want to make it nasty? Add a dollop of bird flu or SARS on the health front, sprinkle in some peak oil talk and the possibility of another large hedge fund or two imploding and you can see how emotionally charged the investment horizon can appear.

These are not one day events, either. These are the types of issues that grab headlines day after day after day. Whether or not the reality of the situation is worsening, play in the media will manage to keep these issues in the headlines and top of mind for the investment community – and with it, a sense of fear.

Very few of these fears can be defused overnight. The geopolitical issues, in particular, tend to persist for decades, with relative visibility ebbing and flowing over time. For the most part, economic fears and health fears are not going to be quelled in the short-term either. At best, they may come and go in cycles and even if they do fall off of our radar, new concerns are likely to bubble up to take their place.

Ultimately, fear spikes, often instantaneously, and leaves an emotional imprint. If too many unsettling events -- or even one event of seismic proportions -- result in the piercing of the comfort threshold of the average investor, then echoes start to show on the tape and fear cannot be put back in the cage.

The data make this clear. The VIX, which in some respects resembles fear, is seven times more likely to spike up three standard deviations in one day than to spike down; it is fifty times more likely to trade three standard deviations above its 10 day moving average than below it. Asymmetrical VIX spikes are not just an issue of frequency, but one of degree too. On the 26 days that the S&P500 has fallen by 3% or more in a single day, the VIX has spiked up an average of 16.8%. Conversely, on the 33 days in which the S&P has risen 3% or more, the VIX has fallen only 9.2% on average.

In most instances, an investor would have been well served to bet on these VIX spikes reverting to the mean within a week or so, but a better understanding of the taxonomy of fear and of important fear thresholds is critical to assessing when to fade the trend and when to ride it.

Tuesday, February 27, 2007

How to Think About the Day After: Executive Summary

It looks like I am going to opt for some sleep over a long night of research, but before I head off to bed, I thought I would offer up some VIX-related bullet points for you to keep in mind as you watch trading unfold tomorrow and beyond:

  • most VIX spikes last one day and start to retrace on the 2nd day

  • the second most common VIX spike pattern is one of 3-5 days in duration before it starts to subside (note that the VIX had already jumped about 10% in the two days prior to today's 64% spike, which might make it even more susceptible to a retracement as early as tomorrow)

  • if the VIX can carry some upward momentum past a second week, it has a fairly high chance of heralding an extended period of much higher volatility

  • a very large majority of VIX moves run out of steam within 10-20 days of the original spike

  • more often than not, the best way to play the VIX is to bet on it reverting to the mean (i.e., 10 and 20 day SMA) after a 3-5 day spike

  • VIX options are *very* difficult to play because...

    • their prices are a function of VIX futures prices, not the underlying VIX prices -- so often the VIX moves a substantial amount in the direction you want, but the call or put moves a lot less or in the opposite direction because the futures expectations change much more slowly than the ‘spot’ VIX price

    • implied volatility in the VIX tends to be extremely high even in relatively placid markets, so swimming upstream faster than time decay can often be harder than it appears

    • if you must play VIX options, consider hedging your bets with some bear call spreads instead of or in addition to buying some puts outright

Wednesday, August 22, 2007

Which Gravity?

In my seemingly never ending quest to litter this space with obscure and occasionally relevant VIX trivia, I have today come across some numbers that I find particularly interesting.

First, let me point out that the VWSI is currently back to reading an even zero, with neither a bullish nor bearish bias. Part of the reason for this neutral reading is the current deadlock in the gravitational tug of war between short-term and long-term mean reversion. Not only that, but in the 17 year history of the VIX, the current 15% under the 10 day SMA and 43% over the 100 day SMA is the largest ever divergence between these two indicators. The question, of course, is whether the gravitational pull of the 10 day SMA (not pictured) will win out over that of the 100 day SMA – or even whether one mean reversion magnet will get the upper hand going forward.

For market historians, there are two instances of possible historical precedent which may be of interest.
In the end of July 2002, we had the largest previous divergence, with the VIX 17% under the 10 day SMA and 32% over the 100 day SMA. This set of circumstances followed the WorldCom bankruptcy filing and came close to signaling the bottom of the 2000-2002 bear market. In fact, in the days leading up to this divergence, the VIX fluctuated wildly to a peak of 48, then dropped to 31 just three days later. Within a week following the maximum divergence, the VIX was back over 45 again; and it remained elevated over the course of the next two months as the markets finally confirmed a bottom.

There is some similar historical precedent in the wake of 9/11, during which period the VIX hit 49, then dropped to 31 five days later, resulting in a VIX 16% under the 10 day SMA and 33% over the 100 day SMA. What followed was a temporary market bottom and VIX readings that went sideways for about five weeks, then began to subside for about nine months, before the July 2002 craziness noted above kicked in.

I am not sure what to conclude, if anything, about the historic divergence at present, other than it is the almost inevitable residue of an unprecedented VIX spike. In a few weeks we will all know whether the liquidity/credit crunch has swallowed up one or more of our trusted financial institutions or, as is usually the case, if investor fears just got a little too far ahead of the reality.

Monday, December 10, 2012

Fear Poll Respondents Focus on Fiscal Cliff, Dismissive of European Financial Crisis

For the eighth week in a row, concerns about the U.S. fiscal cliff topped the VIX and More weekly fear poll. Fears related to excessive central bank intervention nudged out concerns related to government and politicians as the #2 issue, but perhaps the most interesting development is the how much the anxiety related to the European sovereign debt crisis continues to subside.

From a geographical perspective, U.S. and non-U.S. respondents had a relatively low divergence of opinion this week. That being said, whereas U.S. respondents cited the fiscal cliff as the top concern, non-U.S. respondents were most concerned about excessive central bank intervention in the economy. Perhaps part of the fallout from the fiscal cliff negotiations is that U.S. respondents see governments and politicians as much more likely to be the top threat to the stock market, by a margin of 5.6% over non-U.S. respondents.

Interestingly, both U.S. and non-U.S. respondents expressed much less concern about the euro zone problems, with only 4.9% of U.S. respondents citing euro zones as the #1 concern, while 5.9% of non-U.S. respondents put the euro zone issues at the top of the list.

With the FOMC meeting scheduled to wind up on Wednesday, the fiscal cliff talks inching closer to that last day on which legislation can be introduced in Congress for the year (December 18th, based upon a December 21st recess) and Alcoa scheduled to report Q4 earnings and unofficially kick of the next earnings reporting season on January 8th, there is the potential for quite a few things to hit the fan in the coming month.

In spite of all these threats looming just around the corner, the VIX remains subdued and is still in a position to reinforce the notion that December Is the Cruelest Month…for the VIX.

Once again, thanks to all who participated in this weekly poll.

Related posts:

Disclosure(s): none

Monday, March 12, 2007

The VDAX and the VIX in the Wake of 2/27

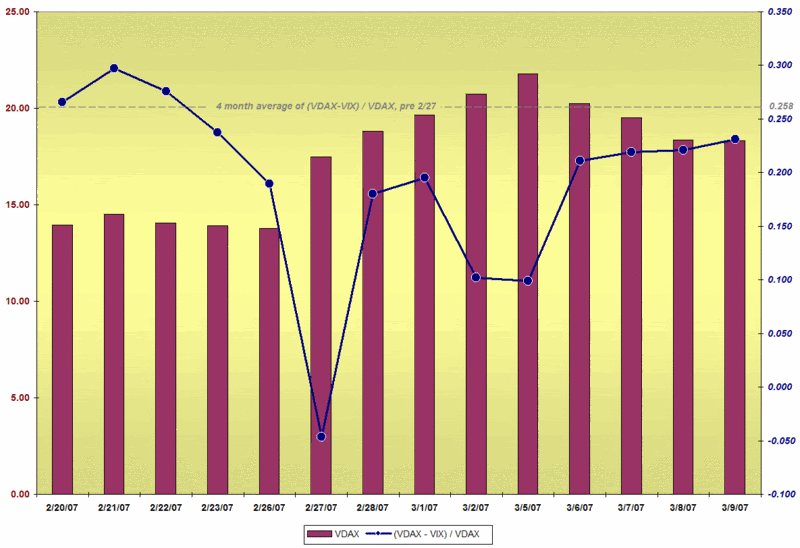
When I introduced the VDAX in this space back on 2/22, volatility was hibernating with the bears on each and every continent and my commentary focused on the high degree of correlation between the VIX and the VDAX. I noted that the two indices often trade in tandem, but pointed out that the VDAX sometimes lags the VIX by one trading day or even two.

With the surge in volatility on the heels of 2/27, this seems like a good time to revisit some of those ideas.

Looking at the data for the four months leading up to 2/27, the difference between the VDAX (VDAX-NEW) and the VIX as a percentage of the VDAX ranged between 17% and 36%, with a mean of about 26% (plotted below as a dashed gray line.)

On February 27, the German markets closed well before the US markets; by the time the VIX had closed for the day, it was trading 5% higher than the VDAX. Over the next week or so, you can see where the VIX and VDAX played lead-lag cat and mouse, as global players tried to place bets ahead of any signs of increasing or lessening international contagion. Only in the last several days, has the VDAX-VIX spread ratio settled into a relatively narrow trading range, which I would interpret as a sign that the major players in the volatility markets believe that the probability of increased volatility or contagion is starting to subside. Whether these traders can accurately help predict the future remains to be seen, but when they stop playing the intermarket volatility game, you should at least incorporate that information into your market outlook.

Monday, March 2, 2009

Three Fear Indicators (or…The Three Baritones)

While the VIX gets most of the media attention as a fear indicator, its usefulness is clearly much better for volatility related to U.S. equities than it is for other asset classes and economic threats.

The TED spread received considerable acclaim in 2008 as measure of liquidity and a reasonable proxy for counterparty risk. Of course gold had been around the longest of all and has served as a barometer of risk for all types of investments and other risks for centuries.

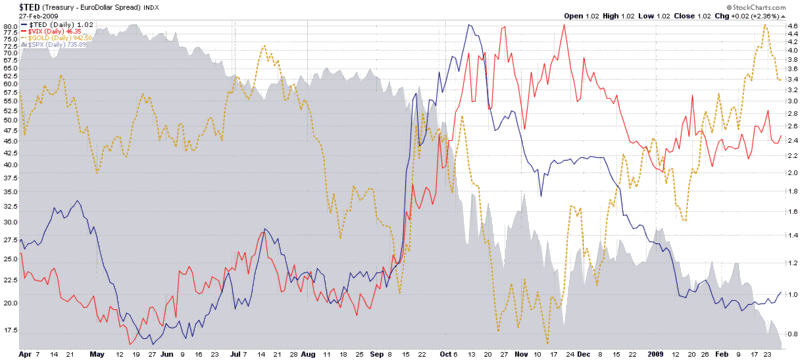
In the chart below, I have overlain the VIX, TED spread and gold against a backdrop of a declining SPX for the past year. Note that the TED spread peaks first among the three, during the second week in October, and subsides rather quickly, as liquidity issues recede to the background. The VIX is next to peak, but it too begins to head down toward the end of November as fears of systemic meltdown slowly begin to subside.

The most interesting line on the chart is that price of gold, which actually bottomed in mid-November and has risen sharply over the past three months, partly as a safe haven for panicky investors, but also as a hedge against the risk of inflation due to various fiscal policy approaches that governments are taking in order to rejuvenate the economy.

In summary, the TED spread has retraced its entire September-October spike, the VIX has retraced about half of its September-November spike, and gold appears to have paused after retracing about 20% of its November-February move. The TED spread and the VIX look like old news at the moment, with the possibility that gold may be the best fear indicator for current market conditions.

[source: StockCharts]

Friday, January 19, 2007

Volatility: Options Expiration Cycle vs. Earnings Season

For those who wonder why VIX options prices sometimes seem to bear little resemblance to movements in the VIX, Brian Overby at TradeKing has a good article, Decoding the VIX II, that explains how VIX options prices are a function of VIX futures prices, not the underlying VIX prices. (FYI, you can find the first half of Decoding the VIX here.)

Overby discusses some of the implications of this pricing phenomenon and concludes:
"This means that the relationship between the actual VIX index and the VIX options “based” on that index are little hard to follow."
While am quick to nod my head in agreement at this, his metaphor about predicting the weather four months in advance based on current data hits closer to home.
"In simple terms, trading VIX options is like trying to trade options on the temperature at some future date. If, for some odd reason, the temperature in south Florida reaches 120 degrees on October 5, that does not help someone to predict the temperature on February 5 of next year. Perhaps, if there a string of 120-degree days, then, maybe, there could be a trend that might presage a warmer winter and a higher than normal temperature on February. Under normal conditions, however, what happens to the temperature on one particular day in September bears very little relationship to what weather will be in February."
More on what this means to come, but the thoughts here might help those trying to understand some of the many idiosyncracies of the elusive VIX.

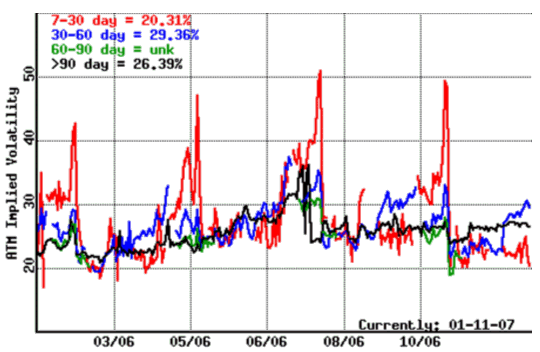
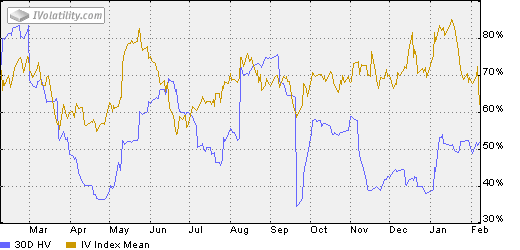
On another front, Clare White at Optionetics.com recently authored CSCO IV Seasonality, which discusses the seasonal implied volatility cycles associated with CSCO and earnings releases. Not surprisingly, graphs of CSCO IV show that IV ramps up in the weeks leading up to earnings and spikes for several days before before earnings, only to subside dramatically after the announcement.
CSCO 2006 implied volatility

The implications, of course, are much broader than CSCO and include the VIX. Since the VIX is looking ahead to volatility over the next 30 days, it is important to know when the S&P500 heavyweights are scheduled to report.

For 2007, I have looked at the reporting dates, by week, for the S&P500 and come up with the following table to identify the number of companies that report each week and in each four week cycle:

Week Current Week Current + 3 Weeks
Week 1 2007 2 166
Week 2 2007 (-1) 4 262
Week 3 2007 (opt exp) 45 307
Week 4 2007 (+1) 115 282
Week 5 2007 98 202
Week 6 2007 49 104
Week 7 2007 20 55

Note that the week after options expirations week is at the peak of the earnings reporting season, with the most companies reporting (115), while the weeks before, during and after options expiration have a roughly equivalent number of companies in the SPX reporting during the four week window that roughly coincides with the VIX futures calculation horizon.

With these two thoughts reverberating in my head, I went back to the VIX Performance During the Options Expiration Cycle post, separated out the prime earnings reporting months (January, April, July and October) and compared them with the other eight non-earnings months. I did this for the week after expiration, which happened to show the highest volatility in my previous analysis. Sure enough, the earnings months were 50% more likely than non-earnings months to show VIX moves to the upside of 10% or 15% and more than twice as likely to show moves of 20% or more.

While the data still support the week after options expiration as the biggest volatility week, it turns out that in non-earnings months, the week after options expiration is no more volatile than average. The bottom line is that, as far as I can tell, it is the proximity to earnings releases that makes the week after options expiration more volatile than other weeks. Perhaps more importantly, in terms of the influence on volatility, earnings season trumps the options expiration cycle by a large margin.

Thursday, October 11, 2007

More on VIX Futures and Volatility Expectations

Don’t tell anyone, but I call these my “More on…” posts because I can be headline-challenged at times...

Moving right along, thanks to an anonymous poster who reminded me that FutureSource.com has excellent free futures data, including intra-day quotes. Since I last checked out their site, they have considerably expanded the information available on the VIX and the newer volatility futures. For easy reference, I have added a link the FutureSource.com volatility futures quotes in the upper right hand corner of the blog.

Yesterday I posted a CBOE chart of the VIX futures data out through August 2008 that showed VIX futures pricing in increased volatility over the next ten months, with most of that priced in as short-term mean reversion anticipated during the November options/futures expiration cycle.

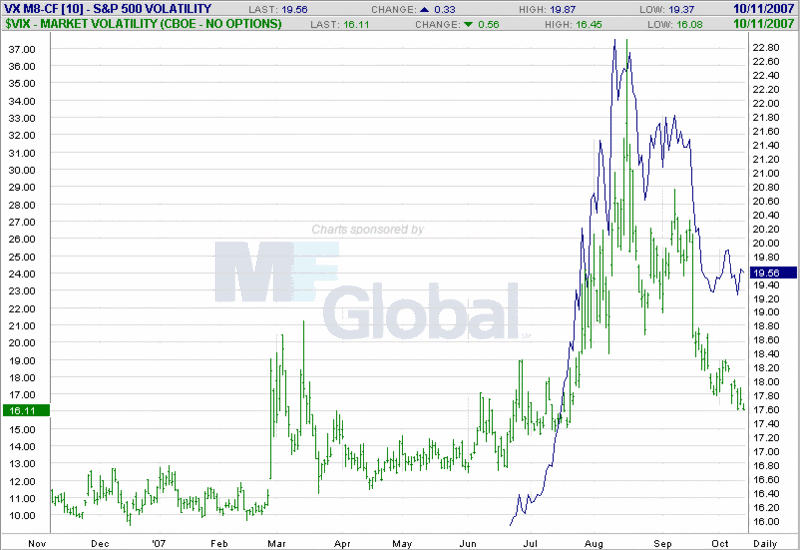
Expanding on that theme somewhat, today’s chart compares the life of June 2008 VIX futures (VX-M8 CF) to the cash VIX for the past year. While you would expect the cash VIX to be considerably more volatile than a futures contract 8-12 months out (recall the February 26-27 cash vs. futures VIX action) this was not the case during the July through August VIX spike and only began to become apparent by the higher readings that persisted in the June 2008 futures after the cash VIX began to subside. What I find particularly interesting about the current situation is that once the cash VIX dropped below 21.00 and kept dropping all the way down to the 16.08 reading earlier today, the June 2008 futures refused to follow. The two different Y-axes somewhat obscures the absolute numbers involved here, but the key takeaway – that of an increasing divergence over the past month – is hard to miss.

It should come as no surprise that the futures and the VWSI are saying the same thing. Once again, the big questions are how long it will take for the spread between the cash VIX and futures VIX to narrow and whether it will be more of a rising cash VIX or a declining futures VIX that will be responsible for a narrowing spread.

Tuesday, February 27, 2007

One Day 20% Spikes in the VIX

There have been 20 VIX spikes of 20% or more in one day since 1990. Today makes 21, with the VIX currently up 21% on the day at 13.52.

Looking at that group of 20 VIX spikes, you can see the footprint of 9/11, the dot com bubble bursting, the Asian financial crisis and similar difficult periods. It is worth pointing out that in 17 of those 20 instances, the VIX was lower 3 days later, 5 days later and 10 days later (interestingly enough, it was a different grouping of VIX spikes that defied the trend in each time period.)

If history is any guide, the VIX should subside about 10% over the course of the next three days and another 2% or so by a week from now. This is the mean reversion tendency of the VIX at work.

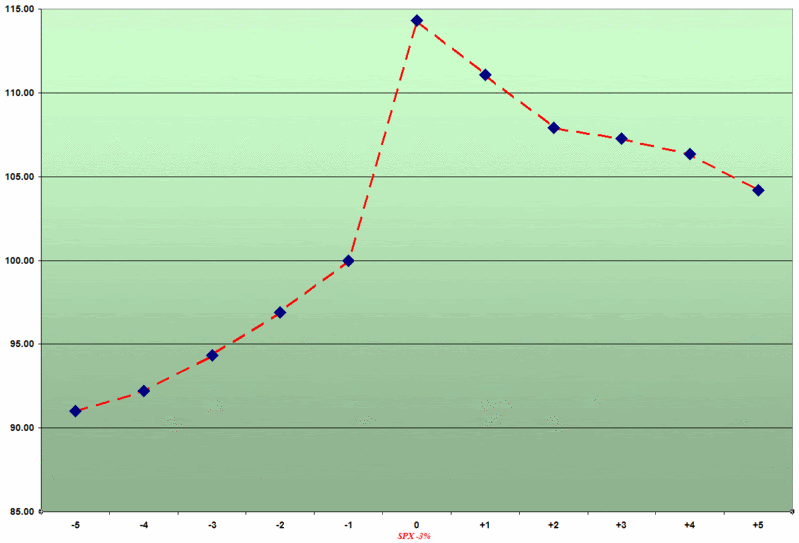
While the SPX is ‘only’ down 1.5% at the moment, it is also worth recalling previous research posted here that when the SPX drops 3%, the VIX’s mean reversion tendency over the next five trading days paints a telling picture.

DISCLAIMER: "VIX®" is a trademark of Chicago Board Options Exchange, Incorporated. Chicago Board Options Exchange, Incorporated is not affiliated with this website or this website's owner's or operators. CBOE assumes no responsibility for the accuracy or completeness or any other aspect of any content posted on this website by its operator or any third party. All content on this site is provided for informational and entertainment purposes only and is not intended as advice to buy or sell any securities. Stocks are difficult to trade; options are even harder. When it comes to VIX derivatives, don't fall into the trap of thinking that just because you can ride a horse, you can ride an alligator. Please do your own homework and accept full responsibility for any investment decisions you make. No content on this site can be used for commercial purposes without the prior written permission of the author. Copyright © 2007-2023 Bill Luby. All rights reserved.
 
Web Analytics