Friday, February 8, 2008

TGIF or OSIF?

It’s Friday, which means that if you have long positions, you are likely to be calculating the risks of holding those positions over the weekend and imagining what sort of headlines might greet you and your portfolio on Monday morning.

There is so much headline risk – or at least perceived headline risk – out there right now that I suspect it will be very difficult for the bulls to put together a sustained rally today. That being said, each Friday going forward is going to be a litmus test of sorts for the bulls, particularly next Friday, which falls just before a three day weekend in the US.

Though this is only the sixth Friday of 2008 and far from enough data points to begin talking about statistical significance and confidence intervals, the first five Fridays of the year have a mean loss of 1.30%, while Mondays through Thursdays have only seen an average drop of 0.37% over the first 21 non-Friday sessions of the year.

In simplistic terms, I do not think that the bulls can make a credible case for a market turnaround as long as they are unwilling to bid prices up in advance of the weekend. When Fridays start looking up and weekend risks start looking palatable, this may be one of the signs that we have put in a bottom.

Index Volatility and Component Correlation

While I was sleeping soundly this morning, Adam at Daily Options Report was already up and deconstructing the volatility of the S&P 500 index. Drawing upon some data compiled by Bespoke Investment Group that show increasing correlation across the S&P 500 sectors during the course of the past six months, Adam concludes that the current high levels of index volatility (VIX, VXN, RVX, VXO, VXD) are due in part to this recent increase in correlation among the components of the S&P 500.

In Correlation Station (no relation to Terrapin Station), Adam breaks it down as follows:

“You can boil index volatility down to two basic factors. One is the volatility of the component stocks, the other is the correlation between those very stocks. And they can very much offset each other. Imagine a world where half the stocks were moving violently and basically trending in one direction, and the other half was moving violently the other way. Index volatility would be very low as the moves would pretty much offset each other.

What we have now is the opposite. Stocks aren't that cosmically volatile, but they are all moving in relative unison. Ergo index volatility is theoretically *high* relative to individual stock volatility.”

There is not much I can do to improve upon that explanation.

While an understanding of the correlation phenomenon is important, I’m sure many are wondering if the current situation is tradeable. For what little it is worth, I am not going to be taking trades that should be winners if correlations start unwinding, but I encourage those who are interested in this subject (yet another type of mean reversion play) to check out Adam’s thinking about some possible trades along these lines.

Thursday, February 7, 2008

Sentiment Failures

I am of the opinion that failures usually provide more important signals than confirmations. For instance, if a company reports good news and sells off, then that action speaks louder than if the stock had bounced on the news (not withstanding all the “buy on the rumor, sell on the news” lore.) The same is true for broad market data and the broader indices. To my mind, these are fundamental failures.
There is an analogous situation with technical analysis. A failure in this context could be a stock or index that has consistently bounced off of a particular support level that now violates that support and continues lower. I believe that these TA failures speak volumes more in terms of informational content than if support had held for the n+1th time.

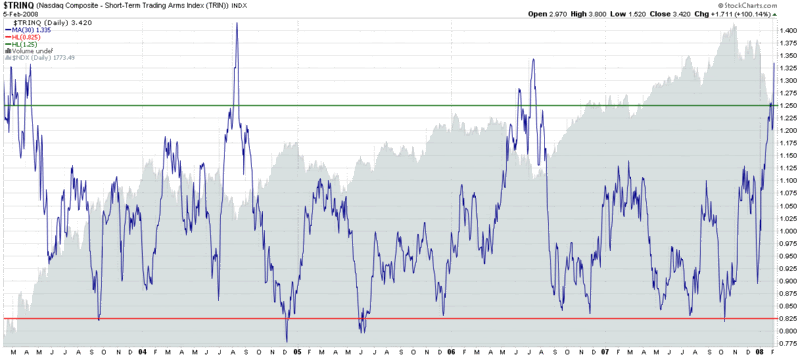
Which brings us to yesterday. Two measures in particular suggested that market sentiment was so strongly negative as to make a bounce a high probability event: the ISEE had just hit a new low in its 20 day SMA and the NASDAQ TRIN (30 day EMA) had spiked to levels not seen since 2002. The bottom line is that it a bounce should have been like shooting fish in a barrel for the bulls. Since the bulls could neither hold onto their gains, nor put a dent in the selloff that ensued, I am forced to conclude that in the course of this substantial sentiment failure, they didn’t even graze any of the fish. I am also changing my bias to bearish until the bulls can demonstrate a modicum of marksmanship…

Wednesday, February 6, 2008

Mean Reversion After Big Drops

Eddy Elfenbein at Crossing Wall Street has a nice little graphic and commentary up today: How the Market Behaves on Big Down Days.

After researching the 37 instances in which the S&P 500 index dropped 3.2% or more (as it did yesterday), Elfenbein draws the following conclusions:

“The average loss for the sell-off is 5.01%. After that, nearly every day is an up day. By the ninth day, the S&P 500 is down 3.48%, which is indeed, a retracement of about one-third. The market still trends higher to the 17th day where it's down just 3.01%, or about a 40% retracement. At that point, the linger effects of the sell-off seem to dissolve.”

Elfenbein’s findings should come as no surprise to those who pay attention to the TRIN and ISEE, as well as the VIX, various market breadth indicators, etc. While volatility has been on the tame side lately, the TRIN, ISEE, and McClellan Summation Index have all been suggesting a strong oversold situation and a high probability mean reversion bullish entry.

The duration of the retracement pattern identified by Elfenbein is also worth noting, as it hearkens back to some work on VIX spike retracements I published last April in Lessons from the Post-2/27 VIX Price Action, where the optimal retracement window was determined to be about eight days.

Tuesday, February 5, 2008

Massive Put Buying on ISEE Toward the Close

About 230,000 equities only puts (vs. about 22,000 calls) between 15:10 to 15:30

Bullish NASDAQ TRIN Signal

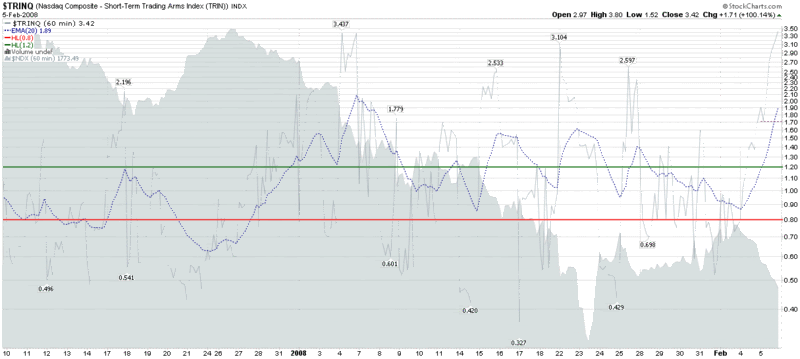
One of my favorite contrarian sentiment indicators is the (NYSE) TRIN and it’s NASDAQ counterpart, which StockCharts.com (responsible for the chart below) codes as the $TRINQ.

The chart I have chosen for today [Edit: updated EOD chart is first chart below; 2nd chart provides longer historical context] uses 60 minute bars over the past two months to demonstrate that in spite of the recent bounce, today’s action sets up another bullish contrarian buy signal – at least in the NDX. This signal looks stronger if you consider the possibility of some support in the 1780 area. Take this with a grain of salt, but consider that the TRINQ’s track record has been very strong as of late.

Also consider that more generally, it may pay to fade any strong move that develops in the current environment of uncertainty – and perhaps to sell premium just beyond important support and resistance levels.


[source:  StockCharts.com]

Volcker Endorses Obama

I do my best to keep politics out of this blog, but I thought it was particularly interesting that several days ago, former Federal Reserve Chairman Paul Volcker announced that he was endorsing Barack Obama. What baffles me and is the main reason I even bother to mention it in this space is how little news play this item has received.
Here we have probably the most important presidential election in a generation or more, with a semi-incumbent running whose husband just happens to be the only President to balance the budget in the past 35 years. Further, despite the war in Iraq, the economy is shaping up as a the key issue in the race and suddenly we have the most famous and revered Fed Chairman coming out in support of...the fresh face whose lack of experience is derided by critics.

I found the following quote from Volcker to be particularly telling:

"It is only Barack Obama, in his person, in his ideas, in his ability to understand and to articulate both our needs and our hopes that provide the potential for strong and fresh leadership."

Monday, February 4, 2008

Divergence Between Put to Call and Volatility Data

Several weeks ago in Checking for Atheists, I talked about how bullish moves can be fueled by a large supply of non-believers who prefer to cling to a wall of worry in times of great uncertainty. These investors often prefer to wait until a bullish move is well established before they cautiously and reluctantly begin to resume long positions.

Volatility indicators, such as the VIX, usually provide an insight into just how worried these investors are, but put to call ratios do us one better: they give us a sense of their numbers. Right now, the numbers are compelling. As I noted in my weekly VIX recap, the ISEE data reflect all-time record lows of new call positions initiated relative to new put positions on the International Securities Exchange (ISE) over the past 20 days – a trend that has carried over to today’s session.

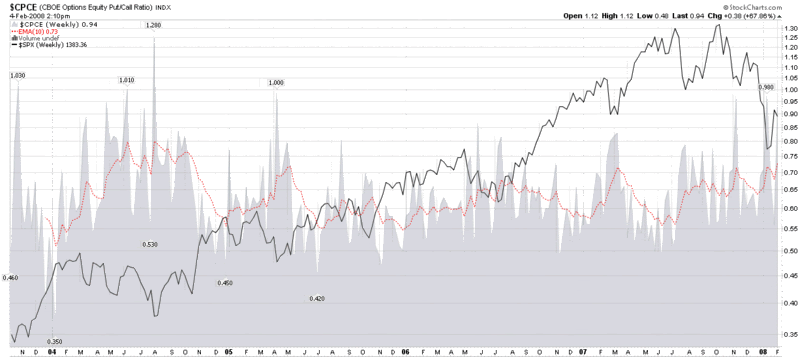
The other important put to call ratio that I follow closely is the CBOE’s equity put to call ratio ($CPCE on StockCharts.com), a chart of which I have included below. Like the ISEE, the CPCE is showing historically high level of puts to calls – in numbers not seen since early 2005. In the chart below, note that P/C readings of 0.70 or higher have consistently been good buying opportunities and today’s 10 day EMA of 0.73 has not been surpassed since May 2005.

Several readers have asked about the significance of a divergence between volatility and put to call readings. As I discussed last May in More Thoughts on the PCVXO, divergences in which volatility readings are much higher than put to call numbers are usually bullish, while the current situation, with put to call numbers much higher than volatility data, tend to resolve in a bearish move going forward.

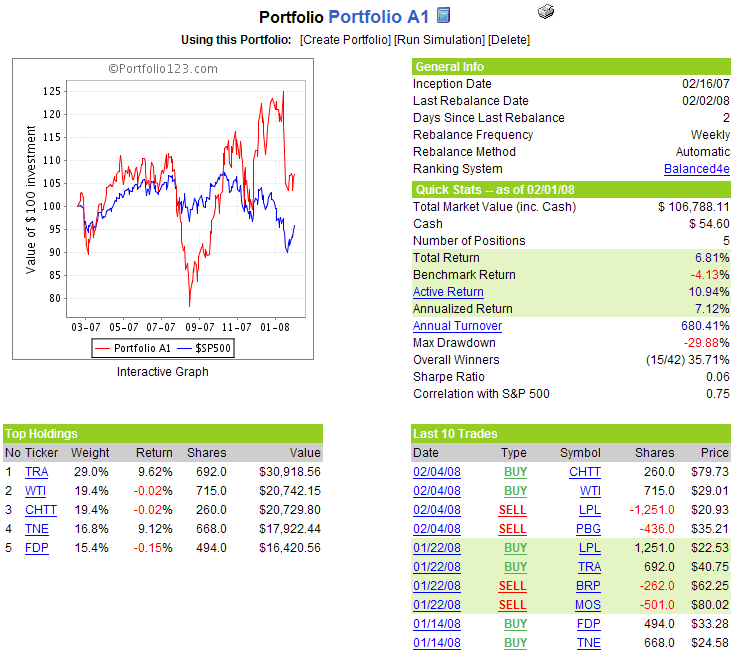
PBG Dampens Relief Rally at Portfolio A1

Last week provided a relief rally for most equities, but Portfolio A1 was barely able to eke out a gain, largely due to a poor earnings report from Pepsi Bottling Group (PBG). Tuesday’s report of flat case growth, increasing costs and guidance well below analysts’ expectations led to widespread dumping of the shares. Despite a rally in the markets, the bottler lost 9.1% for the full week.

In spite of PBG’s woes, Portfolio A1 is still up 6.8% for the 50 weeks since inception, as compared to a 4.1% loss in the SPX over the same period.

Not surprisingly, PBG has been dropped from the portfolio, along with LG Philips LCD Co. (LPL), a pick I was scratching my head about two weeks ago.

An interesting new addition to the portfolio is Chattem (CHTT), a consumer products company whose brands include many products advertised on late night TV (Dexatrim, Garlique, Gold Bond, Selsun Blue, pHisoderm, Kaopectate, etc.) The brands may not be sexy, but the stock has been on a tear. Back in 2000 the stock traded as low as 2.37; Friday it closed at 79.73. The other new addition is W&T Offshore (WTI), a Houston-based oil and gas exploration and production company, with geographical focus on the Gulf of Mexico.

There are no other changes to the portfolio this week.

A snapshot of Portfolio A1 is as follows:

VWSI at +1 as Put to Call Numbers Raise Eyebrows

It may sound strange given all the market drama that has played out so far this year, but 2008 has been a relatively uneventful year so far for those who follow the VIX. Sure there was that two day blip where the VIX traded in the mid-30s during January 22-23, but even then the action in the VIX paled in comparison to everything else that was hitting the fan across the investment universe.

Last week was more of the same. The markets bounced, albeit weakly, and the VIX dropped 5.06 points (17.4%) to end the week at 24.02. While the VIX move looks impressive on paper, it merely brought the volatility index right back to the 50 day simple moving average. The VWSI is also largely discounting last week’s drop in the VIX, as it ticked up from zero +1.

As is my weekly custom, for a survey of the best in current thinking about the markets, Barry Ritholtz at The Big Picture sums up the week that was and the week that is on tap in his Superbowl Linkfest.

Getting back to the VIX and the VWSI, while these numbers are unremarkable, the action in the ISEE suggests that tectonic forces are indeed at work just under the surface, with the ISEE’s 20 day SMA just missing an all-time low on Friday.

(Note that in the above temperature gauge, the "bullish" and "bearish" labels apply to the VIX, not to the broader markets, which are usually negatively correlated with the VIX.)

Wine pairing: For a VWSI of +1, I recommend a guwurztraminer. My favorite American version of this wine is the dry gewurztraminer from Londer Vineyards of Anderson Valley. I have not yet sampled the 2006 vintage, but the 2005 was an unforgettable wine that I would love to see in a blind tasting against some of the top Alsatian competition.

In my previous roundup of California gewurztraminer, I suggested Navarro and Harvest Moon. For some of my top selections from Alsace, check out Trimbach; Hugel; and Domaine Weinbach. You can also check out the top-rated gewurztraminers in the 2007 San Francisco Chronicle Wine Competition.

Friday, February 1, 2008

What Fell and What’s Bouncing

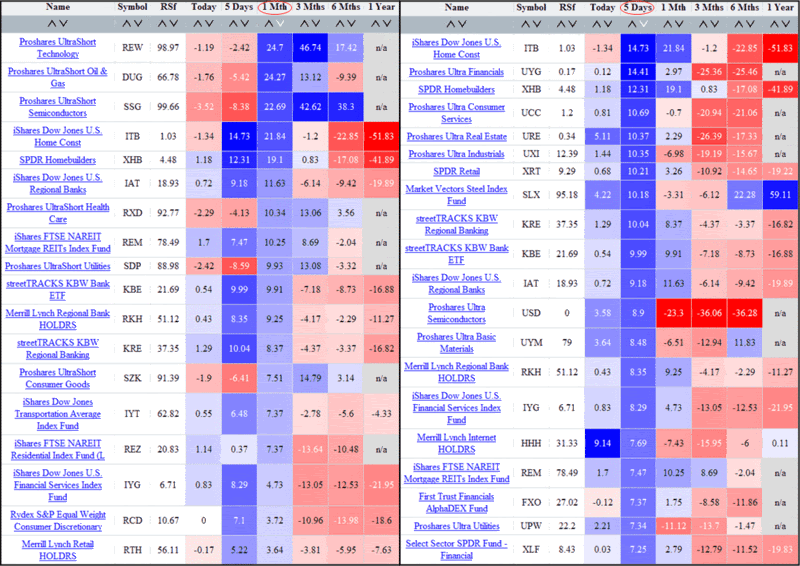
The chart below shows two different performance sorts of sector ETFs. On the left are the top ETF sector performers during the past month; on the right are the top ETF sector performers during the past five days. For the record, these graphics were generated by ETFScreen.com and can be sorted by any time frame specified in the columns.

Not surprisingly, the big winners for the month were the ultrashort ETFs, particularly in technology and energy sectors. On the long side, real estate and finance-related ETFs showed well during the month, an indication that these sectors may be attracting a fair amount of bottom feeding activity.

Switching to performance data for the last five days, one can clearly see the strong buying action in the real estate and financial sectors, with retail and basic materials ETFs also supporting the recent bounce. So far, the bullish action following last week’s bottom has been driven largely by sectors sensitive to interest rates and cyclical growth. The technology sector, which had a nice bounce pre-FOMC, has been largely absent from the party during the past few days.

Thursday, January 31, 2008

Bulkowski on Bottoms

I was surprised to see that while I am in my second year of blogging, I have yet to make a reference to Thomas Bulkowski’s excellent Encyclopedia of Chart Patterns. As the title suggests, this is more of a reference book than a page turner, yet it is an invaluable tool for anyone who is interested in stock charts, whether they would classify themselves as a novice or an expert.
I mention Bulkowski because many people will undoubtedly be trying to determine whether the recent lows are likely to result in a bottom, and what to expect going forward if this bottom holds or if it fails. Bulkowski’s work is an excellent place to start, where you can brush up on a wide range of bottoms he has classified and analyzed from a trading perspective, including the classic Head-and-Shoulders Bottoms, as well as some of the more esoteric Bulkowski favorites, such as Horn Bottoms, Pipe Bottoms, Bump-and-Run Reversal Bottoms, and a variety of double bottom chart patterns.

Whether you agree with all of Bulkowski’s conclusions is not important. Just looking at his work and thinking about how one might go about challenging some of his thinking will more than compensate most traders for the expense of the book. In the end, I find that there is a fair amount that can be swallowed whole and I cannot help but marvel at the meticulous rigor of Bulkowski’s approach, a process that hearkens back to my discussion earlier this week about what makes an expert trader.

In addition to the three books he has written (a fourth, Encyclopedia of Candlestick Charts is due out in the first week of March), Bulkowski maintains a web site, The Pattern Site, that offers a high level view of his thinking, at no charge.

Finally, regarding my own perspective on the recent market action, I am not ready to call a bottom, but the events of the last 48 hours have me thinking that the likelihood we are forming a bottom is much higher than most pundits think.

Wednesday, January 30, 2008

Strength in Financials

I am of the opinion that there is a fine line between bravery and stupidity – and when it comes to front running any FOMC announcements, stupidity often rules the day.

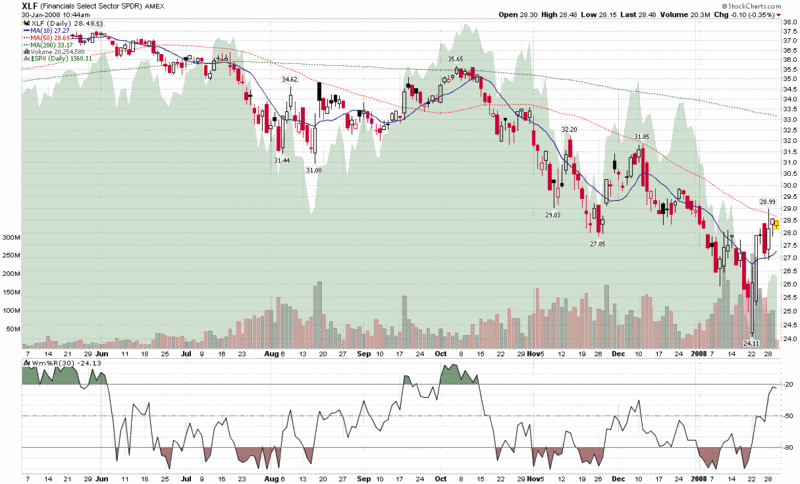
With that in mind, consider the action in the financial sector over the past week or so. Looking at the XLF SPDR, we have an impressive two day bottom put in last Tuesday and Wednesday, with a pop of 20% from a bottom of 24.11 and a potential cross of the 50 day SMA less than 1% away from current levels. The volume at the bottom was impressive and has held up fairly well on the way up. Certainly a cross of the 50 day SMA and a turning up of the 20 day counterpart must bode well for that sector and increase the likelihood that this month’s plunge will ultimately turn out to be the bottom.

All of this is predicated, of course, on the markets having confidence that the Fed is doing the right things to shore up our financial systems, provide appropriate liquidity, and keep the dominoes from getting any wobblier. Presumably, the markets have priced in a 50 basis point move by the Fed today and have valued the financial sector on the assumption that solutions to the current situation – though they may be slow to take root and turn out to be expensive – are going to ultimately resolve the current credit crisis.

I won’t be front running the Fed today, but if the financial sector turnaround means anything – and it usually does – it could mean that there is still a lot of easy money to be made cherry picking some of the stronger names that have beaten down with the rest of the sector.

Tuesday, January 29, 2008

Expert Traders

Brett Steenbarger’s TraderFeed blog is a superb resource for data-driven market analysis as well as a review of many of the important psychological aspects of trading.

I found two recent posts and a promised next installment on trader performance to be particularly insightful. In How Common Is Elite Talent Among Day Traders? Brett cited a study which determined that 80% of day traders lose money. In today’s follow-up, What Makes an Expert? Three Surprising Research Conclusions, Brett concludes that repeatable success can best be attributed to those traders who essentially develop what I would call a closed-loop feedback system and strive for continuous improvement.

The bottom line is that superior trading is not the result of intelligence, tools or a holy grail setup. Instead, top performance is the result of the efforts of those who do the best job of developing and applying a process that takes maximum advantage of experience and learning opportunities to develop and refine one’s edge. In Brett’s words, it’s all about a “structured learning process.” Brett has promised that he will offer up his thinking on what sort of structured learning process would be ideal for traders and when he does, I will be quick to weigh in with my thoughts.

Monday, January 28, 2008

Crossroads Options

Raise your hand if you think the market is at a crossroads where it is more likely to make a big move in one direction or the other rather than just drift sideways from current levels.

I see a lot of hands going up, which doesn’t surprise me, as I also think the markets are at one of those crossroads that precedes a big move. The problem, of course, is getting the direction right.

The most popular way to play a large anticipated move of undetermined direction is with a long straddle or a long strangle. If you get a big move – and particularly if you get is shortly after initiating the position – you will likely be able to lock in a substantial profit. Losses are limited to the cost of opening the position, but if volatility is widely expected, the position can be expensive to open and time decay can be painful.

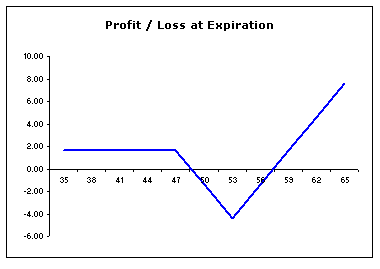
For what it’s worth, I am often partial to a different approach: call backspreads and put backspreads. There a couple of important distinctions between a straddle/strangle approach and a backspread approach. First of all, straddles and strangles can entail a significant initial outlay. With backspreads, on the other hand, you can essentially finance the excess out of the money calls or puts by selling some at the money or slightly out of the money options and end up with a net credit or zero cost transaction. Second, if the options sold are at the money or out of the money, you will make money if the underlying does not move. Finally, as the graphic below (of a call backspread) demonstrates, the big windfall with a back spread is unidirectional. So unlike the straddle or strangle, large profits only accrue when you can call the direction of the move.


If you are interested in learning more about backspreads, check out John Summa’s Backspreads: Good News for Breakout Traders article in Investopedia.com.

DISCLAIMER: "VIX®" is a trademark of Chicago Board Options Exchange, Incorporated. Chicago Board Options Exchange, Incorporated is not affiliated with this website or this website's owner's or operators. CBOE assumes no responsibility for the accuracy or completeness or any other aspect of any content posted on this website by its operator or any third party. All content on this site is provided for informational and entertainment purposes only and is not intended as advice to buy or sell any securities. Stocks are difficult to trade; options are even harder. When it comes to VIX derivatives, don't fall into the trap of thinking that just because you can ride a horse, you can ride an alligator. Please do your own homework and accept full responsibility for any investment decisions you make. No content on this site can be used for commercial purposes without the prior written permission of the author. Copyright © 2007-2023 Bill Luby. All rights reserved.
 
Web Analytics