Monday, January 14, 2008

VWSI at Zero as VIX Meanders

There is probably a better word out there to describe the recent lack of action in the VIX, but I’m going to stick with ‘meander’ for now. After weekly changes of 9% or more in one direction or the other for 11 out of the past 12 weeks, the VIX dropped a mere 0.26 (1.1%) last week to end the week at 23.68. Perhaps more important, in spite of those 12 relatively volatile weeks, last week’s close leaves the VIX just 0.10 above the 50 day SMA, indicating that this has been a lot of running hard simply to stay in the same place.

The VIX Weekly Sentiment Indicator (VWSI) is as unimpressed by the recent market downturn as the VIX, currently registering a zero, which indicates no bias toward increasing volatility.

As is my weekly custom, for a survey of the best in current thinking about the markets, Barry Ritholtz at The Big Picture sums up the week that was and the week that will be in his Mid January Linkfest: Review / Preview.

Looking forward, I am still puzzling over the implications of the recent lackluster VIX. Three possible conclusions immediately jump out at me:

  1. the markets have a lot longer to fall and won’t bottom until we have a meaningful VIX spike (I consider this possible, but certainly not a fait accompli, as I spelled out in Can the Markets Bottom Without a VIX Spike?);

  2. investors are not particularly fearful at the moment because after six months of hearing about an upcoming disaster have bought all the puts they want and/or are getting desensitized to additional bad news;

  3. the VIX no longer has the predictive value it once had, due in part to the flourishing of double inverse ETFs like the QID and other increasingly popular instruments for the bearishly inclined.

I will be evaluating all three possibilities going forward and will update my thinking here as it evolves.

(Note that in the above temperature gauge, the "bullish" and "bearish" labels apply to the VIX, not to the broader markets, which are usually negatively correlated with the VIX.)

Wine pairing: For a VWSI of zero, I began 2007 by recommending some Rhone blends and later expanded the category to include any expensive blend. Over the course of the year, my two favorite inexpensive blends turned out to be the $8 Oakley Five Reds (the 2003 vintage is a blend of 41% syrah, 27% zinfandel, 22% petite sirah, 10% alicante bouschet, and 1% mourvedre from Cline Cellars); and the 2005 vintage of The Hermit Crab from D’Arenberg, a delicious $13 blend of 70% viognier and 30% marsanne.

Friday, January 11, 2008

Scrolling Back…

I have had several requests to revive last year’s practice of periodically publishing links to some of my favorite recent posts from other blogs.

With the caveat that I have not been rigorous about bookmarking all of my favorites, here are some recent posts that I think may have some archival significance well beyond the day they were posted:

Thursday, January 10, 2008

Chart Porn

If I had tried a little harder, I’m sure I could have come up with a better title for this post, but something like “Strange and Unusual Charts You are Guaranteed Not to Find Anywhere Else” and their ilk seemed like too much work.

So let me summarize the current market situation, if I can. Essentially, almost all the momentum and support/resistance charts say that a bear curtain has descended upon the markets. On the other hand, Panglossian types are still able to find solace in the fact that some oscillators suggest that the recent moves down have been excessive. Additionally, they can always change the moving averages on their charts from days and weeks to months in order to support their contention that the markets are in the midst of pulling back to support. At this stage, deciding which camp has the most like-minded souls has as much to do with one’s philosophy and outlook as it does the result of rigorous analysis.

In the end, it’s quite possible that none of this matters. As one commenter from yesterday suggested, perhaps the only things that do matter are what the bearded man sings and how mellifluously it falls on our ears (that and perhaps whether he is a baritone or a castrato.) Hint: if it’s Das Lied von der Erde, I’m buying gold.

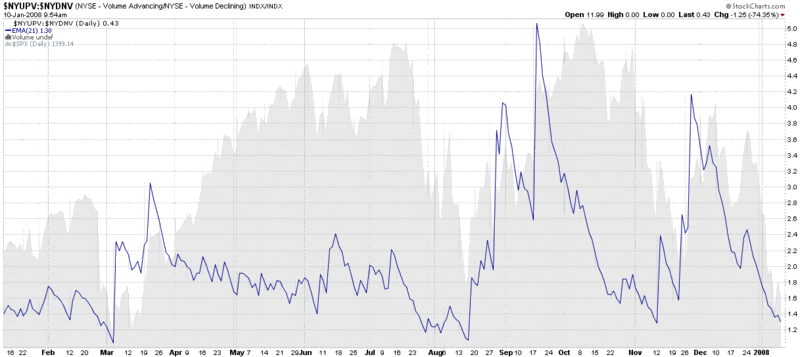
But enough silliness for now. Getting back to some chart porn, I am including the chart below not so much because the conclusions are fresh (“things are bad” or “things are about to turn,” depending upon your perspective), but because I’m fairly sure you cannot find this chart anywhere else. The chart tracks the ratio of up volume to down volume for the NYSE and uses a 21 day EMA to smooth the data. The NASDAQ version of the data looks similar, but this NYSE chart shows the potential for volume data to help call both tops and bottoms in advance. So dial up some Mahler and watch the volume.

Wednesday, January 9, 2008

Can the Markets Bottom Without a VIX Spike?

Back in November, in Not a Lot of Fear or Volatility Lately, I cautioned, “despite what you read elsewhere, not all market bottoms require a high volume capitulation session, with an accompanying VIX spike.”

Of course, that claim immediately triggered a request for me to back up my claim with some data: Could you describe or show an example of a major bottom without a volume and or VIX spike?

For the benefit of those who do not always read the comments section, I am reprinting my response in full, as it may shed some light on current market conditions.


I knew I should have had the answer handy before the inevitable question showed up -- and the ink wasn't even dry on my post yet...

OK, since StockCharts.com only has SPX weekly volume going back to 10/98 and since I'm more interested (generally) in the VIX than in SPX volume, I looked at the VIX and SPX on a weekly basis going back to 1990, which is as far back as VIX data goes, and here is my thinking:

A) Classic capitulation (VIX spikes at least 2x above previous levels and volume surges) bottoms appear in Aug-Dec 1991, Mar 1994, Aug 1998, Sept 2001, and July 2002. More recent instances include May-Jul 2006, Feb-Mar 2007, and Aug 2007.

B) Bottoms that lack a significant VIX spike (in the area of 2x above previous levels) include Jul-Sept 1996, Mar 1997, Mar 2001, and Sept-Oct 2002. More recent examples include Mar-Aug 2004 (one bottom or three mini-bottoms), Aug 2005, and October 2005. I am not ruling out the current [November 27, 2007] environment as another one of these 'uneventful bottoms.'

Note that "major bottoms" may mean one thing to one person and other to someone else. I'd be tempted to argue that the only major bottoms we've had since the VIX data begins are 1990 and 2002 -- so the bottoms above are necessarily more of the intermediate and long-term variety.

So the answer to the question posed in the title is a hearty, “Of course they can!” As a matter of fact, I expect the current downtrend will likely end without the VIX spiking even close to twice the recent levels.

Tuesday, January 8, 2008

Arrow Up For Tomorrow

I generally shy away from making stock market predictions and prefer the Stuart Walton jellyfish approach to investing, but sometimes the markets get so egregiously out of whack that I feel obliged to state the obvious. In this case the obvious is that the probability of a short-term rally beginning tomorrow is extremely high.

Many of the overbought/oversold indicators that I study closely (ISEE, TRIN, VXN, etc.) suggest that the markets are ready for a bounce tomorrow. In short, tomorrow is setting up to be a mean reversion, oscillator lover's shooting gallery. Keep in mind, however, that if the markets do not make a U-turn into oncoming traffic, it is often more instructive to observe what the markets fail to do than what they actually end up doing.

In the jellyfish tradition, when a bounce arrives, I have no intention of trying to guess how long it will last. The important question is whether large investors will be selling into any rally to unload inventory before the bear market grip tightens – or if this may be the beginning of another periodic pullback in the continuing 5 ½ year bull trend.

As always, caveat emptor!

The Fallacy of the Bearish First Five Days

I will be the first to admit that one of my favorite trading books to browse through is the Stock Trader’s Almanac, complied by Jeffrey Hirsch and Yale Hirsch. The current version of this annual classic, Stock Trader’s Almanac 2008, has already been sitting on my desk for three months.

I mention this book because the authors have been instrumental in widely disseminating the idea of the ‘January Baromenter,’ which posits that “as goes January, so goes the market.” While the idea of the January Barometer dates back to at least 1972, the corollary, which should be on the mind of many investors today, is that the first five days of January provide an effective ‘early warning system’ about the trend for the balance of the year.

Before I critique these two ideas, let me point out that the data for the general premise of January as a microcosm of a full trading year is compelling. Using the S&P 500 index, the January Barometer includes only five major errors in the past 58 years; and 31 of the last 36 times the first five days were up, the year ended up as well.

But before you load up on more QID in anticipation of the market being sucked into a black hole, it is important to recognize that the data obscures what happens when the year gets off to a particularly ugly start, as it has in the first four trading days of year (through yesterday), where the SPX has been down 3.6%.

As it turns out, since 1950 the SPX has only had a five day start that was worse than 2008 on two occasions: 1978 and 1991. In both cases, however, the year managed to turn around and finish in the green. In 1978, the SPX shook off a -4.7% first five days and was up 6.0% the rest of the year. The turnaround in 1991 was even more dramatic, as anyone who owned NASDAQ stocks (up 56.8% that year) will surely recall. After falling 4.6% the first five days of 1991, the SPX was up 32.5% for the remainder of the year.

If one wants to expand the analysis to the worst full month starts since 1950, the four worst of these starts also turned around by the end of the year as well. In 1970, January was down 7.6%, but the balance of the year was up 8.4%. In 1960, it was -7.1% followed by +4.5%; in 1990 it was -6.9% and +0.3%; and in 1978 it was -6.2%, with a +7.7% turnaround from February through December.

As always, be careful with what you take away from this analysis. Of the 21 Januarys that the SPX has been down, the balance of the year was down 10 times and up 11 times. The bottom line? If there is any message worth remembering from the data above, it is that good starts tend to persist, ugly ones tend to reverse, and slightly down beginnings run the greatest risk of turning into a rout.

Monday, January 7, 2008

One Year Blogiversary!

Today marks exactly one year since I decided to launch VIX and More as a place to archive some of my thinking on volatility and the markets.

There have been times when I would have been better served to spend additional time and energy to do more research, analysis, system development, etc., but on balance, having a blog has been more fun than work and the exchange of ideas via comments and e-mail has had a positive impact on my trading.

Thanks to all who have contributed to this site by reading, commenting, and linking to some of what I have had to say. Particular thanks to those blogs who have sent the most traffic my way:

What have readers found most compelling on this site over the course of the past year? Of the 422 posts that 117,000+ unique visitors have had a chance to review during my first year, here are the top 25 most read posts:

  1. A Sentiment Primer (Long)
  2. Correlation Ideation
  3. How to Find the Spiker Before the Earnings Announcement
  4. BuyWrite Index as a Timing Tool?
  5. Commercials Get Long the VIX in a Big Way
  6. High Positive Correlation Between VIX and SPX Often Signals Market Weakness
  7. When to Short China?
  8. A Baker’s Dozen of Favorite Indicators
  9. Waiting for Godot
  10. A Dozen Things My Trading Accounts Are Thankful For This Year
  11. What My Dog Can Tell Us About Volatility
  12. Implied Volatility and Earnings Spikers
  13. Drilling Down on Sector Performance
  14. Brian Overby on Trading VIX Options
  15. First Annual VIX and More Blog Disclaimer Awards
  16. The McClellan Summation Index
  17. Thinking About the VXV
  18. The Incredible Shrinking VIX
  19. Using the VIX as a Timing Tool for the SPY
  20. VIX Price Movement Around FOMC Meetings
  21. A Challenge to Two Things You Think You Know About the VIX
  22. VIX March OTM Calls
  23. What’s in the FXI?
  24. The Promethian Trader
  25. Greenspan and the China Bubble

Portfolio A1 Begins 2008 By Increasing Gap on SPX

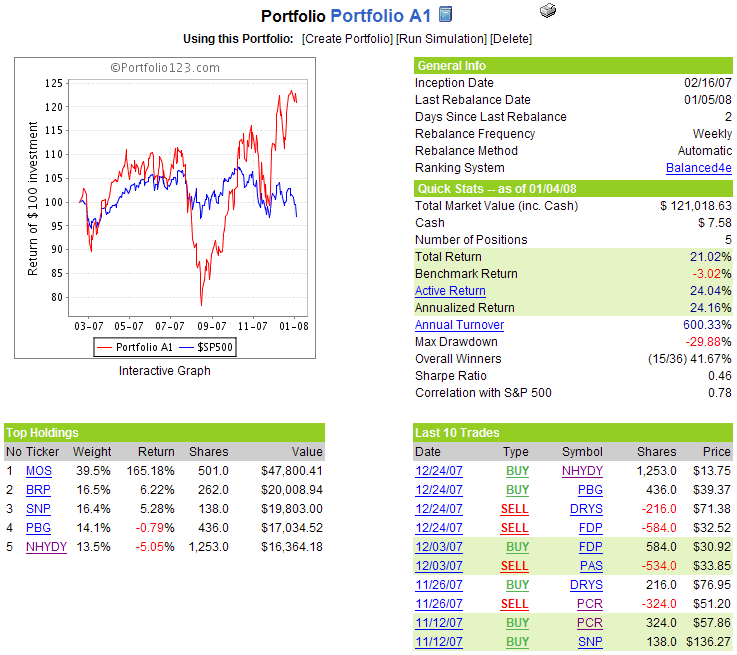
While the first three trading days of 2008 knocked 0.8% off of the value of Portfolio A1, this was much better than the 3.9% loss in the benchmark S&P 500 index. Since the February 16, 2007 inception, Portfolio A1 now stands with a gain of 21%, in contrast to a 3% loss for the SPX.

Brasil Telecom Participacoes S.A. (BRP) was the only stock in the portfolio that advanced during the week, bucking the downtrend in US-based technology stocks.

There no changes to the portfolio this week.

A snapshot of Portfolio A1 is as follows:

Sunday, January 6, 2008

Muted Reaction from VWSI as Markets Drop

The US markets sold off in dramatic fashion last week, with critical technical support levels failing to hold in a number of key indices, including the tech heavy NASDAQ Composite and NASDAQ 100, as well as the small cap Russell 2000. For a change, the damage in tech stocks was greater than it was in the SPX, where financials continue to be the most highly weighted sector.

As I chronicled on Friday, this has been a “low fear selloff” even when one focuses on the volatility index of the hard hit NASDAQ 100, the VXN. In terms of the VIX, the reaction has also been comparatively mild. Last week the VIX rose 3.20 points (15.4%) to 23.94. While this is the highest end of week close in six weeks, an SPX drop of 4.5% typically triggers a rise of about 19% in the VIX, so a 15.4% rise has to be considered a lackluster move relative to market conditions.

Consistent with a lackluster VIX in the face of considerable selling, the VWSI dropped only to -3, suggest a slight mean reverting bias going forward.

As is my weekly custom, for a survey of the best in current thinking about the markets, Barry Ritholtz at The Big Picture sums up the week that was and the week that will be in his Linkfest 2008 Review/Preview.

Looking ahead, it is worth noting that the two consecutive weekly jumps of 10% or more in the VIX has only happened six time since 9/11 – and the last five of those have seen the VIX fall in the subsequent week. After two weeks of 12.3% and 15.4% gains, I would not be surprised to see the VIX pull back a little in the coming week.

(Note that in the above temperature gauge, the "bullish" and "bearish" labels apply to the VIX, not to the broader markets, which are usually negatively correlated with the VIX.)

Wine pairing: For a VWSI of -3, I continue to recommend a barbera. While Italy produces the best know barberas, Barbera d’Asti and Barbera d’Alba, it is fruity, highly drinkable version of this wine from the Sierra Foothills that recently tickled my fancy: the 2005 Renwood Sierra Series barbera. If you are looking for a different varietal to add to your list of everyday reds, seek this one out. For only $9 at my local wine store, it’s a bargain and a great change of pace.

If you are interested in an entertaining and informative look at Italian barbera, I encourage you to check out Gary Vaynerchuk at Wine Library TV, with The Barbera Episode.

Friday, January 4, 2008

The Low Fear Selloff

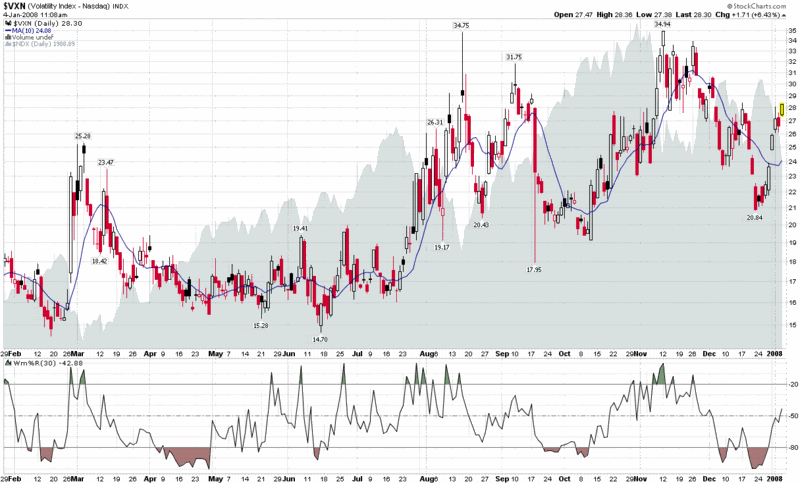
Now that most of the holiday-related “calendar reversion” (nicely coined by Adam at the Daily Options Report) is behind us, we have the opportunity to get a fresh look at unadorned volatility. You know what? There is not that much of it out there, particularly given the current market conditions.

Since the NASDAQ is suffering the brunt of the damage today, I have chosen to include a graph of the VXN, or NASDAQ-100 volatility index. Given the market conditions, you would expect the see the most ugliness here, yet volatility looks surprisingly tame, particularly since the NASDAQ Composite was down 78 points when this snapshot was taken.

I’m having a big storm here in Northern California, with high winds and frequent loss of power, so don’t be surprised if VIX and More ends up offline for awhile, as I am not particularly well hedged against meteorological volatility.

[Note that the image above is from Port Orford, Oregon, a current capture of the spectacular webcam from Home by the Sea, a B&B situated on a bluff overlooking Battle Rock Beach]

Thursday, January 3, 2008

Yes, I’m Frequenting More Blogs These Days

I’m sure nobody bothers to pay attention to this, but I periodically tweak the “Blogs I Frequent” section of VIX and More whenever a particular whim hits me. Since I’ve had that set of links up for almost a year, I thought I should clarify what it is and why certain blogs are there.
First, when I began blogging I had no idea what a feed was and I was under the mistaken impression that a blog would be the best way for me to keep track of links to all of my favorite blogs. That approach worked for awhile, until my news appetite expanded to the point where I needed to scroll down to access all my information source links and the ‘simplicity’ of the approach became too cumbersome for my liking. Fortunately, necessity birthed not just invention, but some technology test drives as well, and I settled on Bloglines as my favorite tool for managing feeds, as I detailed back in April.

I mention all of this because Bloglines is my primary news aggregation source 99.9% of the time, delivering 242 feeds on a relatively timely basis. Every once in awhile, Bloglines has technical difficulties and I resort to a backup system. Usually that backup takes the form of Google Reader, but there are some occasions where I prefer to fall back on the blog.

Now I trade primarily as a result of charts, technical analysis, market sentiment indicators and the like, but I don’t particularly enjoy looking at everyone else’s charts, which is why the list of the blogs I frequent has a disproportionately fundamental and macroeconomic focus and why the sequence (and invisible grouping) might appear chaotic. Ultimately, my blogroll is a somewhat arbitrary subset of my Bloglines feeds, with preference given to sites that I rarely if ever see on other blogrolls.

For all these reasons, I have recently added three important voices to my blogroll:

Finally, thanks to all who have made VIX and More a part of their blogroll or personal reading list during the past year.

Wednesday, January 2, 2008

McMillan on Interest Rate Moves Preceding Volatility

Interesting fodder for further contemplation, from options guru Larry McMillan in Barron's: Volatility Likely to Remain High in 2008.

The article is much more interesting that the title might suggest and discusses a 'theory' that short-term interest rates precede volatility by 2 1/2 years. While this sounds like a stretch to me, if you believe the theory, then the VIX should be topping in early 2009 -- which just happens to be about the time suggested by some of my VIX macro cycle work. Certainly worth a click through for the curious...

Selloff Overdone Prior to FOMC Minutes Release?

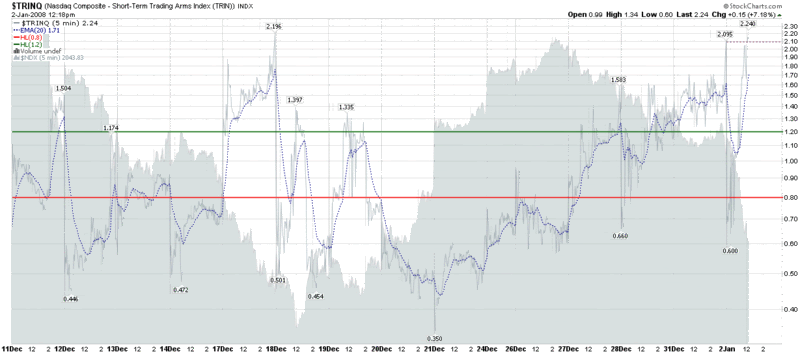
In the hour and 40 or minutes or so before the FOMC releases the minutes from their December meeting, I am using the market weakness to make some buys. I have a number of reasons for doing this, not all of which I am going to detail here. Instead, I will post a chart of the NASDAQ TRIN, the counterpart to the NYSE TRIN that I discussed a couple of days ago. TRIN numbers can be calculated for each exchange. I watch the NASDAQ closely because the NASDAQ often leads the NYSE in terms of determining speculative sentiment.

In the chart below, I use 5 minute bars over a 10 day range. My thinking, in a nutshell, is not that I can guess what the FOMC minutes will reveal, nor even how the market will react to it, but I suspect that if the news is considered bullish by traders, the market will move much more decisively than if the news is considered to be bearish.

I consider this a contrarian sentiment play, with an asymmetrical news reaction magnitude potential. From a probability perspective, it’s about a 50% play; from an expectation perspective, I think the numbers are solidly in my favor.

Sector Clues in First Hour of 2008?

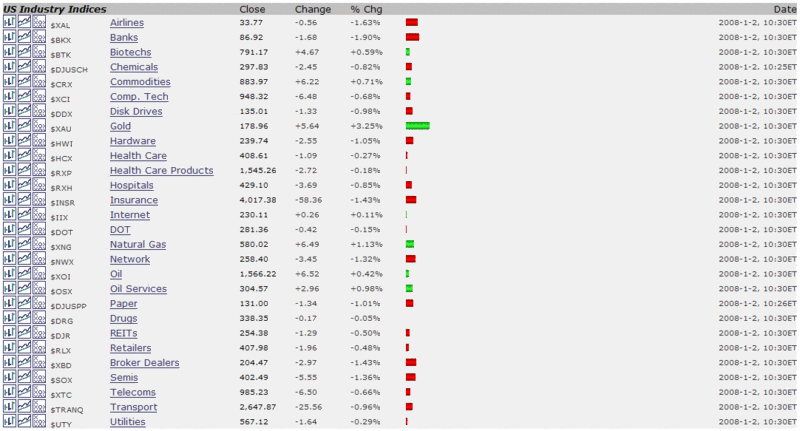
It’s never too early to try to discern what some of the new investing themes for 2008 might be, which is why I have included the StockCharts.com sector snapshot for the first hour of trading.

Given the low ISM numbers this morning, I am not surprised to see weakness across the equity spectrum. A couple of commodity sectors – gold and natural gas among them – are continuing their strong end of 2007 momentum into the beginning of the new year. One pocket of bullishness in the first hour that surprised me and is worth watching going forward is biotech.

On the downside, banks continue to get hammered, while REITs are currently in the middle of the pack.

Tuesday, January 1, 2008

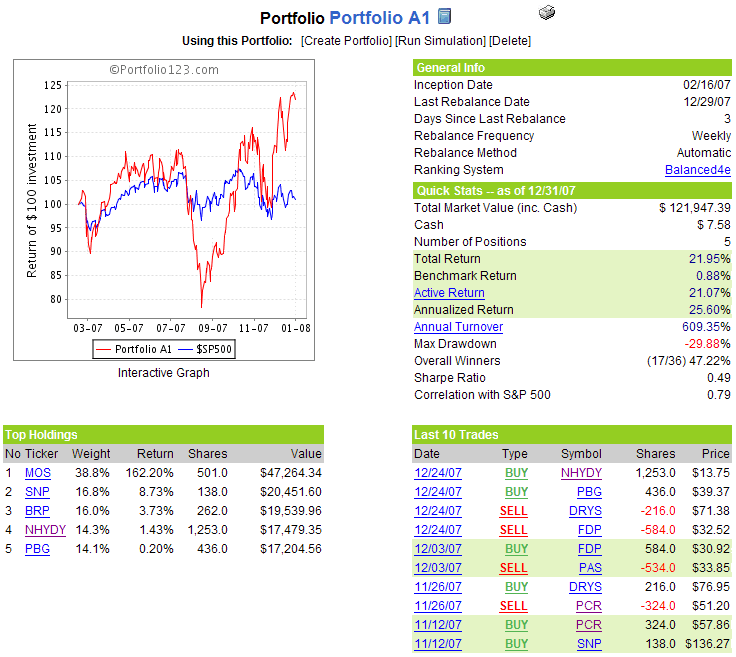
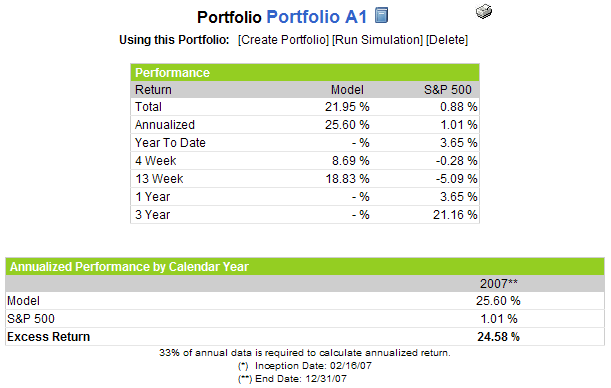
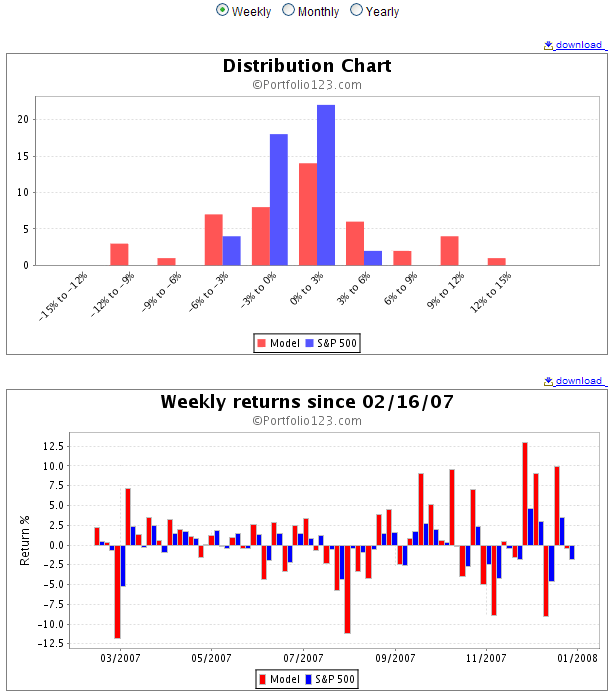
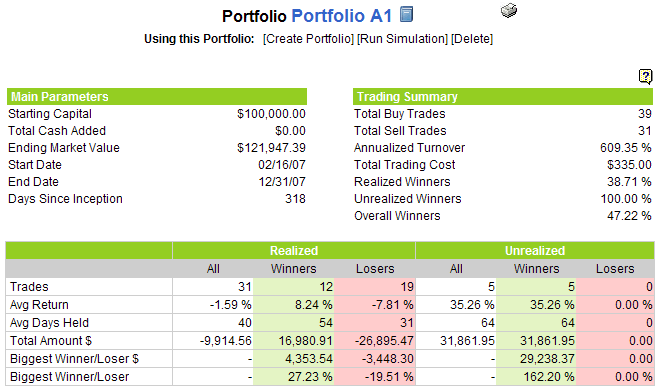
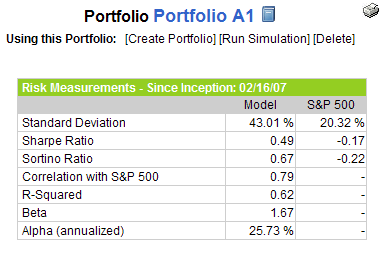
2007 Performance: Portfolio A1 +21.95% (from 2/16/07)

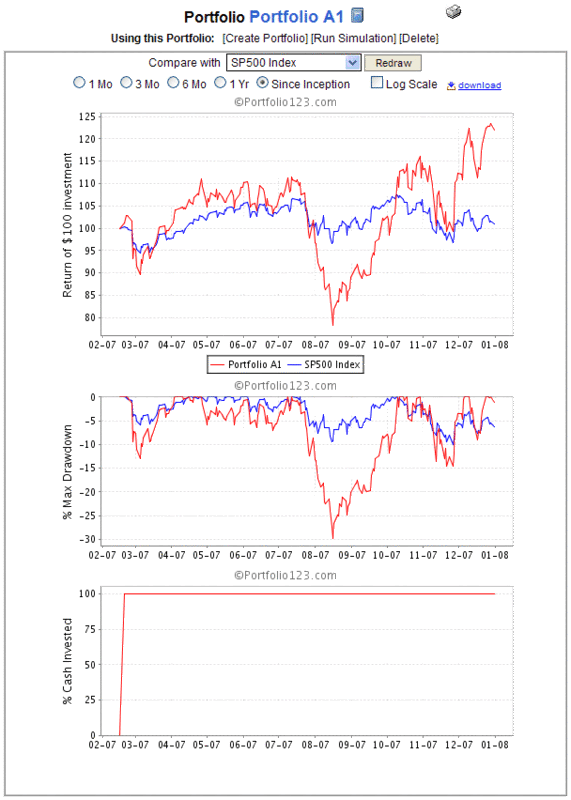
I am official closing the books on 2007 for Portfolio A1 with a 21.95% gain since the portfolio’s February 16th inception. This performance is 21.07% better than that of the SPX during the same period.

In addition to the usual portfolio summary statistics and equity curve, I have included some additional graphics that should be largely self-explanatory.

[For more information on the technology used to create and maintain this portfolio, check out an earlier post, Portfolio123.com: The Engine Behind Portfolio A1]


DISCLAIMER: "VIX®" is a trademark of Chicago Board Options Exchange, Incorporated. Chicago Board Options Exchange, Incorporated is not affiliated with this website or this website's owner's or operators. CBOE assumes no responsibility for the accuracy or completeness or any other aspect of any content posted on this website by its operator or any third party. All content on this site is provided for informational and entertainment purposes only and is not intended as advice to buy or sell any securities. Stocks are difficult to trade; options are even harder. When it comes to VIX derivatives, don't fall into the trap of thinking that just because you can ride a horse, you can ride an alligator. Please do your own homework and accept full responsibility for any investment decisions you make. No content on this site can be used for commercial purposes without the prior written permission of the author. Copyright © 2007-2023 Bill Luby. All rights reserved.
 
Web Analytics