Showing posts sorted by date for query sample size. Sort by relevance Show all posts

Monday, February 25, 2013

All-Time VIX Spike #11 (and a treasure trove of VIX spike data)

Today was one of those days that caught a lot of people off guard. Halfway through today’s trading session stocks we largely unchanged, then some pockets selling began when results of the elections in Italy started trickling in, suggesting the possibility of a deadlock in the Italian parliament and perhaps the need for another round of elections.

The governmental chaos is largely the result of rise of two intriguing political figures. One of these is the phoenix known as Silvio Berlusconi and his People of Freedom (PDL) party, which is anti-austerity and has proposed a policy of massive tax cuts and talked about the possibility of leaving the euro. The bigger electoral surprise is Beppe Grillo and the Five Star Movement (M5S), where Grillo’s populist agenda and anti-corruption message have resonated with voters. Both Berlusconi and Grillo have had a much stronger influence on the elections than most had anticipated and with Italy’s relationship with the euro zone now in question, the euro fell to under 1.31 against the dollar for the first time in six weeks.

U.S. stocks, which had seemed impervious to the sequestration threat, began selling off sharply as a result of the confusion about the future of the Italian government, with selling gathering steam during the second half of today’s session and accelerating sharply during the last hour, when the S&P 500 index fell more than 1% and the VIX spiked 14.4%.

For the full day, the SPX was down 1.83% and the VIX was up 34.02%. The 34% spike in the VIX makes it the eleventh largest one-day spike in the 24 years of VIX historical data going back to 1990.

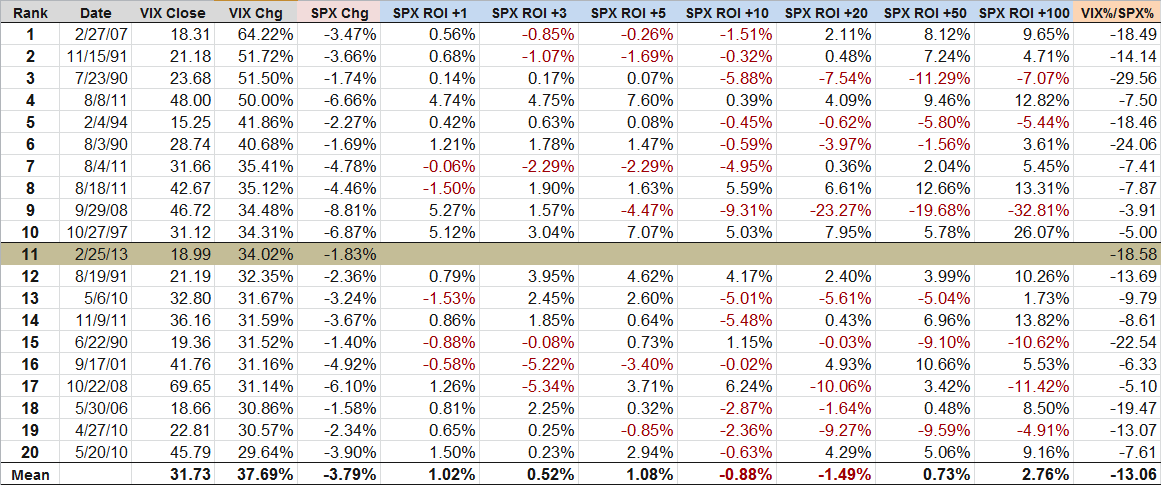
The first question on everyone’s mind is what the implications of the VIX spike are for stock prices and volatility going forward. The truth is that the historical record following a large one-day VIX spike is somewhat spotty. The table below captures some data from the top 20 one-day VIX spikes. Note that on average (here is where I like to remind everyone that it is possible to drown crossing a stream that is one inch deep ‘on average’) stocks generally outperformed following a big VIX spike for up to one week (SPX ROI +1 to +5 days) and also performed well looking out more than two months. From one week to two months, however, stocks have underperformed following a large VIX spike.

Note that the table below is based on a small data set and if one extracts subsets of this data for the VIX at certain absolute levels or during selected periods or even relative to the magnitude of the change in the SPX, it is possible to draw some very different conclusions. Part of the reason for this may be due to the sample size and part of the answer may be that a clear-cut interpretation of this data is not easy to extract. For these reasons, I have included a fair amount of relevant data and encourage readers to draw their own conclusions.
[source(s): CBOE, Yahoo, VIX and More]

For those who are interested in more conclusive research and analysis on VIX spikes, volatility and other subjects related to today’s events, the links below are an excellent place to start.

Related posts:

Disclosure(s): short VIX at time of writing

Monday, May 10, 2010

New Record for One Day Fall in the VIX

The VIX spikes up, but it rarely spikes down, today’s action notwithstanding. In fact, today’s 29.6% decline in the VIX is the largest single day decline in the 17 year history of the VIX and in the 20 years of reconstructed VIX data.

Using reconstructed data for VXO, which utilizes the original calculation methodology for the VIX, I find only one instance in the last 24 years in which the VIX declined more than it did today: Wednesday, October 21, 1987, two days after Black Monday, when the (original calculation) VIX fell 47% from 140 to just under 74. [For background information, try VXO Chart from 1987-1988 and Explanation of VIX vs. VXO for more information on VXO]

In thinking about the relative abundance of VIX spikes and scarcity of dramatic VIX drops over the course of history, I sometimes like to invoke the metaphor of a medieval castle. A dragon periodically appears and terrorizes the castle and its inhabitants, sometimes visible for only a fleeting moment and other times hanging around for an uncomfortably long period of time. Every time the dragon appears, the citizens panic. One day a knight goes out into the forest and slays the dragon, returning with the head of the beast. The citizens rejoice and relax for a moment, until it occurs to them that the forest may be filled with dozens of dragons.

So…one dead dragon does not mean the crisis has passed.

Getting back to statistics, the VIX has fallen 20% in one day on eight previous instances. On average, looking forward one day, week, month, quarter, etc., stocks have tended to underperform somewhat following a sharp drop in the VIX. The last two instances of 20% drops, from October 2008, have now skewed the data so that aggregate performance looks quite dreadful. Still, one can argue that in the first three of the eight instances (1993, 1994 and 2006), stocks outperformed historical averages when looking at least two months out. All things considered, small sample size and all, I would have to conclude that today’s action translates to a mildly bearish outlook going forward – at least based on historical data.

For more on related subjects, readers are encouraged to check out:

Disclosure(s): short VIX at time of writing

Wednesday, May 9, 2007

CXO Advisory Group on CBOE Put to Call Ratio and ISEE

Yesterday, the CXO Advisory Group published an analysis of the CBOE total (index plus equity) put to call ratio, looking out at 5, 21 and 63 day time horizons. They concluded that relative to the S&P 500 index data, the CBOE total put to call ratio is "not a useful indicator for short-term or intermediate-term trading" and found that the put to call numbers are more likely to lag rather than lead the S&P 500 data.

In a follow-up piece this morning, the folks at CXO examined the ISEE data in a similar fashion. While they found a stronger relationship between the ISEE and the S&P 500 index, they expressed concern about the sample size in the course of concluding that the ISEE "may offer a slight edge for intermediate trading," particularly at the 63 day horizon.

My suggestion is that you read both of the CXO articles in full and take a look at my comments about the usefulness of the ISEE 50 day simple moving average and Bernie Schaeffer's recent comments and charts regarding the CBOE equity put to call ratio. Of the three CBOE put to call measures (index, equity, and total put to call ratios), I put considerably more stock in the equity variant, which tracks most closely to the ISEE.

I will have more to say about the ISEE and the CBOE put to call ratios in the future. While I believe that following these ratios is a worthwhile endeavor for gauging investor sentiment, I strongly suggest that they not be the only arrow in your quiver.

Monday, May 7, 2007

ISEE at 173 Intra-Day

I generally don't get particularly excited about intra-day sentiment numbers, but I was surprised to see that the ISEE jumped from a low opening reading of 108 to a relatively stratospheric 173 as of 11:30 EDT. The smaller sample size makes the first few readings of each day less significant, but I am now on notice to pay closer attention to this indicator as we move forward.

For the record, since August 2006 there have only been two closes above the 173 level: a 184 on 12/18 and a 175 on 1/16. Obviously, neither of those readings signaled an imminent top, but in three of the seven days just prior to the May 2006 top, we did see the ISEE close over 200.

Friday, March 23, 2007

20% Under the 10 Day SMA, Then What?

As usual, Adam Warner of the Daily Options Report has been all over the latest developments in VIX. He was the first to comment on the VIX falling 20% under its 10 day SMA on Wednesday (actually -19.3%) and has added two follow-up stories, most recently this morning, where he draws comparisons to the June-July VIX walkabout from last year.

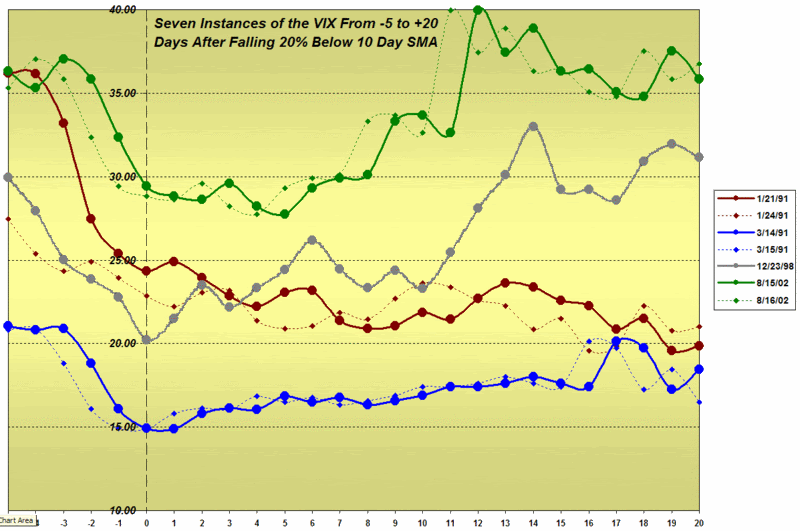
To recap for those why may be link shy, the VIX has closed 20% below the 10 day SMA on seven days since 1990, which I have grouped into four distinct events (one isolated event and three other events with two separate EOD readings,) as follows:

> 8/15-16/2002
> 12/23/1998
> 3/14-15/1991 (3/13 was 19.9% below)
> 1/21/91 and 1/24/91 (1/18 through 1/25 were all at least 18% below)


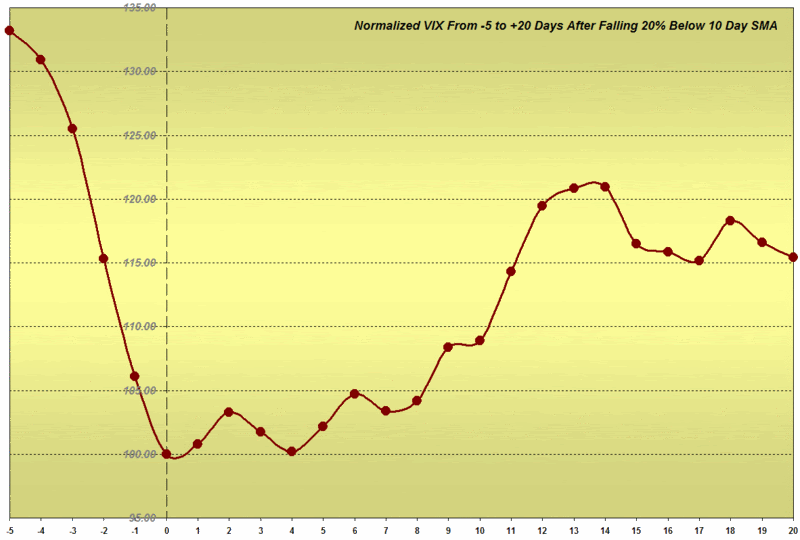
The only additions I will make to Adam’s commentary are two graphs that appear in one form or another on these pages on a fairly regular basis: a composite look at all 7 instances, from 5 days prior to 20 days after the -20% reading; and a rather busy graph of each of those 7 instances, color coded by ‘event,’ with the second -20% reading for each event indicated by a dotted line. The graphs, not surprisingly, suggest a possible mean-reverting move over the next 10-20 trading days, but given the small sample size, I would consider their entertainment/voyeuristic value to be higher than any informational value.

Tuesday, February 27, 2007

One Day 30% (!) Spikes in the VIX

Nobody has asked yet, but I might as well save those who are contemplating the question a few keystrokes.

Since the VIX was officially rolled out in 1993, there have been only 4 days in which it spiked up 30% or more. Turn the clock back to 1990 and you find a total of 8 days.

For those who might be interested, the mean reversion expectations following a +30% move are very similar to that of +20% days, which I weighed in on this morning. The data sample size is small enough to not be statistically significant, but still, in the 3, 5 and 10 days following the VIX spikes, 6/8, 7/8 and 5/8 of the VIX moves had reversed. The mean retracements were 9% and 11% over the 3 and 5 day period, but 10 days out, the mean move had continued upward 4%, owing largely to the strength of one subsequent 52% spike in the VIX.

The VIX has not made a 40% move to the up side since February 2, 1994, when the Fed’s decision to raise interest rates sent shock waves through the markets.

Wednesday, January 24, 2007

A History of Sub-10 VIX Closes

Today the CBOE Volatility Index closed under 10.00 for just the ninth time since it was launched in 1993. Three questions immediately arise from this fact:

  1. What is the history of sub-10 closes?
  2. What does the current one mean?
  3. How might the current situation be tradeable?

Today we will start with the first question, touch on the second one, and push the third one off until tomorrow morning.

The 1993-94 Lows

Looking at the history books, prior to 2006, the VIX closed below 10.00 on five occasions: four consecutive days in late December 1993; and once in late January 1994. In all instances, the VIX rebounded sharply higher 3, 5, 10, 20 and 50 days later. For the record, the SPX was little changed in the 3/5/10/20/50 day time from the four consecutive days in December 1993, but did sell off following the January 1994 low.

The details are as follows:

Sub-10 VIX #1-4) On 12/23-24/1993 and 12/27-28/1993 the VIX closed at 9.31, 9.48, 9.70 and 9.82, respectively. For comparison purposes, the SPX closed in the range of 467-471 during the same period. Three days later, the VIX was already up 6%, 10%, 10% and 19%. By the fifth trading day, those same gains had been extended to 15%, 23%, 30% and 21% from those closes. Ten trading days from the VIX lows, the VIX was up 21%,16%, 11% and 15%, while the SPX was anywhere between flat to up 1.0%. Twenty trading days from the lows, the VIX still showed cumulative gains of 20%, 17%, 20% and 16% from the original lows, with the SPX flat to up 1.6%. The more dramatic action came in the next 30 trading days, as 50 days from the original lows, the VIX was trading between 14.41 and 16.23, for cumulative gains of 72%, 50%, 57% and 47%. By the 50 day mark, the SPX had drifted down slightly, between -0.6% and -1.0% of the corresponding December close. The bottom line: the VIX was a good long at these lows and the SPX did not move for the next 50 trading days. In fact, there was no substantial drop (single day or cumulative) in the SPX until February 1994 and the SPX drifted sideways until the end of March 1994.

Sub-10 VIX #5) About a month later, on 1/28/1994, the VIX closed at 9.94, the last time it would close that low until November 2006. Looking at the same 3/5/10/20/50 day trading frame, the VIX rallied from that low to 10.61, 15.25, 14.46, 14.87 and 16.62, representing gains of 7%, 53%, 45%, 50% and 67% from the low. This time there was movement in the SPX, as it posted moves of +0.7%, -2.3%, -1.8%, -2.4% and -6.5% over the corresponding 3, 5, 10, 20 and 50 trading day periods. The big move behind the SPX numbers was a -2.3% drop in the SPX on the 5th trading day following the 1/28 low. This also happens to be the 28th, 29th, 30th and 31st trading day following the four consecutive December 1993 VIX lows. For the next 65 trading days, the SPX slid steadily lower, from 469 to 460, before dropping another 21 points over the course of four trading days.


A New Era in 2006-07?

Sub-10 VIX #6-7) On 11/20-21/2006, the VIX closed below 10.00 for the first time in a dozen years. While the 50 day ROI calculations are still two weeks away, the 3/5/10/20 day analysis shows gains of 8%, 17%, 13% and 3% for the first date and 24%, 9%, 14% and 4% for the second date. These VIX lows occurred in the fourth month of what is now a continuing six month upward move in the SPX, which has it currently 2.7% and 2.8% above the corresponding November values. There was a -1.4% drop in the SPX three trading days after one close and four trading days after the other close, on 11/27/06. I would not consider this drop to be noteworthy, however, as it was fully retraced over the course of the next two trading days and indeed the SPX has moved decisively higher over the past two months.

Sub-10 VIX #8) On 12/14/2006, the VIX once again closed below the psychologically significant 10.00 barrier. In the subsequent 3/5/10/20 day period, the VIX has had relatively tepid gains of 3%, 6%, 16% and 6%. The SPX has been drifting sideways for most of this period, but with today’s strong move now stands 1.0% above the 12/14 close.


Interpretation of the Current (#9) Sub-10 Close

To say that the VIX has closed under the 10.00 mark nine times is to stretch the truth a bit, as some of these daily closes might better be considered as multiple instances of two short-term volatility lulls in late 1993 to early 1994 and late 2006 to early 2007. Each of these two periods had a multiple days of consecutive sub-10 closes followed by an “echo low” approximately one month later. So far, today’s sub-10 close can only be considered another echo low, until we see how the balance of the current VIX lull plays out.

This categorization has important statistical implications. Is it two clusters of lows or nine independent data points? Either way, the small sample size has little statistical validity, but it is harder still to draw conclusions from two data points scattered over the course of 15 years.

Still, the data reflect that for each of the previous sub-10 closes, the VIX was higher 3, 5, 10, 20 and 50 days after the sub-10 close. For the 20 day period, the VIX has always rallied at least 10% and an average of 19% from the low. For the 10 day period, the returns are more widely dispersed, but the average is 22%. If we look out 50 days, the minimum return is 47% and the average return is 60%. The important caveat is that the 50 day ROI data do not yet include reaction to the 2006-07 VIX lows.

Now that investors have become somewhat accustomed to the low VIX numbers, we’ve been hearing the “It’s different this time!” calls for the past few months – and perhaps it is. Today is the 22nd day in a row that the VIX has set a new low for the 100 day SMA. I’m not convinced that it is different this time, but I do think that any knee-jerk reaction to buying VIX calls is not the best way to approach the current situation.

DISCLAIMER: "VIX®" is a trademark of Chicago Board Options Exchange, Incorporated. Chicago Board Options Exchange, Incorporated is not affiliated with this website or this website's owner's or operators. CBOE assumes no responsibility for the accuracy or completeness or any other aspect of any content posted on this website by its operator or any third party. All content on this site is provided for informational and entertainment purposes only and is not intended as advice to buy or sell any securities. Stocks are difficult to trade; options are even harder. When it comes to VIX derivatives, don't fall into the trap of thinking that just because you can ride a horse, you can ride an alligator. Please do your own homework and accept full responsibility for any investment decisions you make. No content on this site can be used for commercial purposes without the prior written permission of the author. Copyright © 2007-2023 Bill Luby. All rights reserved.
 
Web Analytics