Thursday, January 31, 2008

Bulkowski on Bottoms

I was surprised to see that while I am in my second year of blogging, I have yet to make a reference to Thomas Bulkowski’s excellent Encyclopedia of Chart Patterns. As the title suggests, this is more of a reference book than a page turner, yet it is an invaluable tool for anyone who is interested in stock charts, whether they would classify themselves as a novice or an expert.

I mention Bulkowski because many people will undoubtedly be trying to determine whether the recent lows are likely to result in a bottom, and what to expect going forward if this bottom holds or if it fails. Bulkowski’s work is an excellent place to start, where you can brush up on a wide range of bottoms he has classified and analyzed from a trading perspective, including the classic Head-and-Shoulders Bottoms, as well as some of the more esoteric Bulkowski favorites, such as Horn Bottoms, Pipe Bottoms, Bump-and-Run Reversal Bottoms, and a variety of double bottom chart patterns.

Whether you agree with all of Bulkowski’s conclusions is not important. Just looking at his work and thinking about how one might go about challenging some of his thinking will more than compensate most traders for the expense of the book. In the end, I find that there is a fair amount that can be swallowed whole and I cannot help but marvel at the meticulous rigor of Bulkowski’s approach, a process that hearkens back to my discussion earlier this week about what makes an expert trader.

In addition to the three books he has written (a fourth, Encyclopedia of Candlestick Charts is due out in the first week of March), Bulkowski maintains a web site, The Pattern Site, that offers a high level view of his thinking, at no charge.

Finally, regarding my own perspective on the recent market action, I am not ready to call a bottom, but the events of the last 48 hours have me thinking that the likelihood we are forming a bottom is much higher than most pundits think.

Wednesday, January 30, 2008

Strength in Financials

I am of the opinion that there is a fine line between bravery and stupidity – and when it comes to front running any FOMC announcements, stupidity often rules the day.

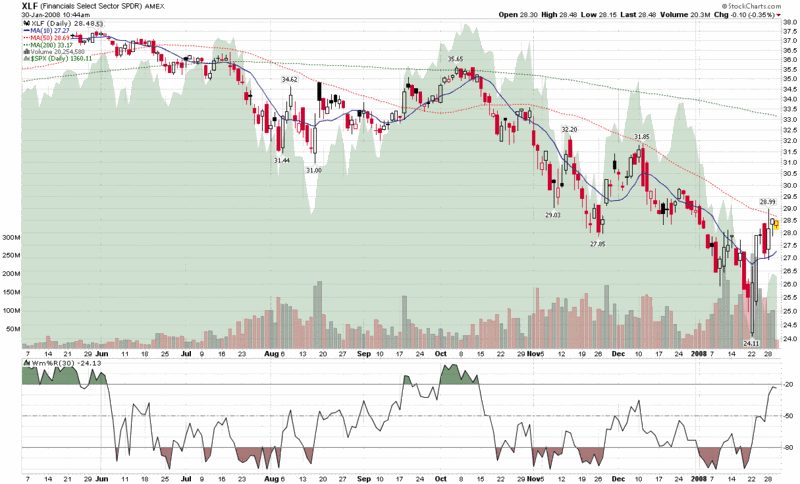
With that in mind, consider the action in the financial sector over the past week or so. Looking at the XLF SPDR, we have an impressive two day bottom put in last Tuesday and Wednesday, with a pop of 20% from a bottom of 24.11 and a potential cross of the 50 day SMA less than 1% away from current levels. The volume at the bottom was impressive and has held up fairly well on the way up. Certainly a cross of the 50 day SMA and a turning up of the 20 day counterpart must bode well for that sector and increase the likelihood that this month’s plunge will ultimately turn out to be the bottom.

All of this is predicated, of course, on the markets having confidence that the Fed is doing the right things to shore up our financial systems, provide appropriate liquidity, and keep the dominoes from getting any wobblier. Presumably, the markets have priced in a 50 basis point move by the Fed today and have valued the financial sector on the assumption that solutions to the current situation – though they may be slow to take root and turn out to be expensive – are going to ultimately resolve the current credit crisis.

I won’t be front running the Fed today, but if the financial sector turnaround means anything – and it usually does – it could mean that there is still a lot of easy money to be made cherry picking some of the stronger names that have beaten down with the rest of the sector.

Tuesday, January 29, 2008

Expert Traders

Brett Steenbarger’s TraderFeed blog is a superb resource for data-driven market analysis as well as a review of many of the important psychological aspects of trading.

I found two recent posts and a promised next installment on trader performance to be particularly insightful. In How Common Is Elite Talent Among Day Traders? Brett cited a study which determined that 80% of day traders lose money. In today’s follow-up, What Makes an Expert? Three Surprising Research Conclusions, Brett concludes that repeatable success can best be attributed to those traders who essentially develop what I would call a closed-loop feedback system and strive for continuous improvement.

The bottom line is that superior trading is not the result of intelligence, tools or a holy grail setup. Instead, top performance is the result of the efforts of those who do the best job of developing and applying a process that takes maximum advantage of experience and learning opportunities to develop and refine one’s edge. In Brett’s words, it’s all about a “structured learning process.” Brett has promised that he will offer up his thinking on what sort of structured learning process would be ideal for traders and when he does, I will be quick to weigh in with my thoughts.

Monday, January 28, 2008

Crossroads Options

Raise your hand if you think the market is at a crossroads where it is more likely to make a big move in one direction or the other rather than just drift sideways from current levels.

I see a lot of hands going up, which doesn’t surprise me, as I also think the markets are at one of those crossroads that precedes a big move. The problem, of course, is getting the direction right.

The most popular way to play a large anticipated move of undetermined direction is with a long straddle or a long strangle. If you get a big move – and particularly if you get is shortly after initiating the position – you will likely be able to lock in a substantial profit. Losses are limited to the cost of opening the position, but if volatility is widely expected, the position can be expensive to open and time decay can be painful.

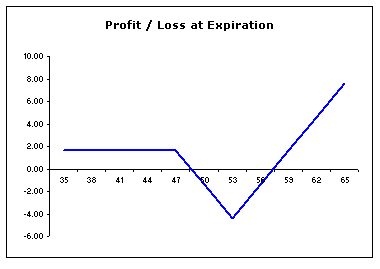
For what it’s worth, I am often partial to a different approach: call backspreads and put backspreads. There a couple of important distinctions between a straddle/strangle approach and a backspread approach. First of all, straddles and strangles can entail a significant initial outlay. With backspreads, on the other hand, you can essentially finance the excess out of the money calls or puts by selling some at the money or slightly out of the money options and end up with a net credit or zero cost transaction. Second, if the options sold are at the money or out of the money, you will make money if the underlying does not move. Finally, as the graphic below (of a call backspread) demonstrates, the big windfall with a back spread is unidirectional. So unlike the straddle or strangle, large profits only accrue when you can call the direction of the move.


If you are interested in learning more about backspreads, check out John Summa’s Backspreads: Good News for Breakout Traders article in Investopedia.com.

Portfolio A1 Bounces Back

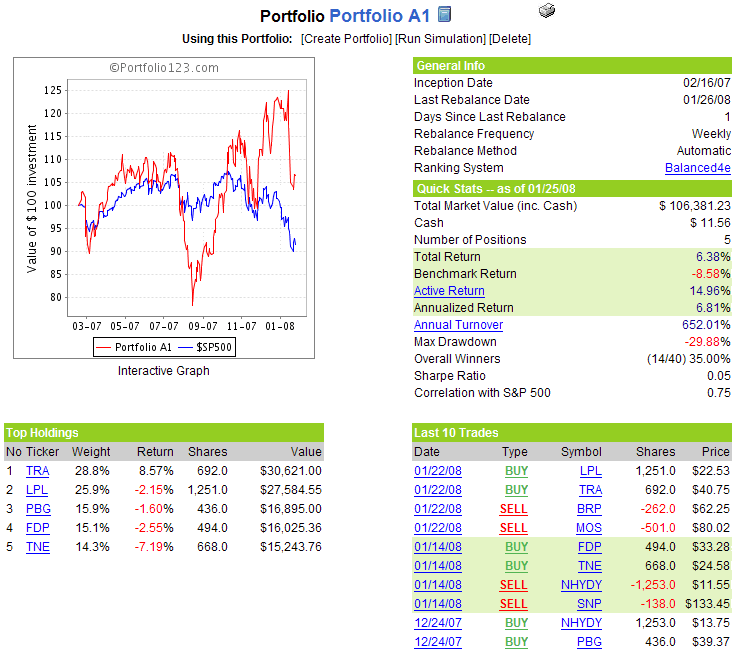
While it was not a big bounce, the fact that Portfolio A1 bounced 1% more than the benchmark S&P 500 index did last week has to be considered a good sign. After 49 weeks, the portfolio’s 6.4% gain still compares quite favorably to the 8.6% loss in the SPX over the same period.

New addition Terra Industries (TRA) led the way with an 8.6% gain for the week, after taking the fertilizer baton from previous portfolio anchor, The Mosaic Company (MOS).

The 2008 year to date numbers (through Friday) show that Portfolio A1 has fallen faster than the SPX – -12.8% vs. -8.7% – with the superior cumulative performance numbers for the portfolio largely a reflection of a superb fourth quarter in 2007. Some may see this as a possible anomaly, but this portfolio is set up to ‘fish for whales,’ a theme I will expound upon in the future.

There no changes to the portfolio this week.

A snapshot of Portfolio A1 is as follows:

VWSI at Zero After VIX Hits 5 ½ Year High

You know it’s an interesting market when the VIX hits a 5 ½ year high (37.57) on Tuesday, while the VWSI actually manages to end the week down a point at zero.

Part of the reason for these statistical oddities is that the VIX fell 23% from Tuesday’s high to Friday’s close, resulting in a weekly gain of ‘only’ 1.9 (7%.) The 29.08 close is the second highest end of week close since March 2003, behind only the 29.99 close in the middle of August 2007.

With a 23% move already accounted for, the VWSI has a neutral volatility outlook going into the week, apparently viewing last week’s volatility snap back move as already having fully discounted future mean reversion opportunities.

As is my weekly custom, for a survey of the best in current thinking about the markets, Barry Ritholtz at The Big Picture sums up the crazy week that was and the week that lies ahead in his End of January Linkfest.

As we wait for the Fed to announce their next move(s), this might be a good time to cut back on trading an brush up on some reading. In case you missed it, I would start with Roger Lowenstein’s [author of When Genius Failed: The Rise and Fall of Long-Term Capital Management] The Education of Ben Bernanke from last Sunday’s New York Times. Three books I have recently enjoyed that are particularly pertinent to current markets are:

Also, for links to Fed speeches, charts of market action on Fed Days, etc., don’t forget my collection of Fed Links.

(Note that in the above temperature gauge, the "bullish" and "bearish" labels apply to the VIX, not to the broader markets, which are usually negatively correlated with the VIX.)

Wine pairing: For a VWSI of zero, I began 2007 by recommending some Rhone blends and later expanded the category to include any expensive blend. Over the course of the year, my two favorite inexpensive blends turned out to be the $8 Oakley Five Reds (the 2003 vintage is a blend of 41% syrah, 27% zinfandel, 22% petite sirah, 10% alicante bouschet, and 1% mourvedre from Cline Cellars); and the 2005 vintage of The Hermit Crab from D’Arenberg, a delicious $13 blend of 70% viognier and 30% marsanne.

Friday, January 25, 2008

The Game Is Afoot

Today’s bearish reversal is the first minor skirmish following the recent selloff and attempt at a bottom.
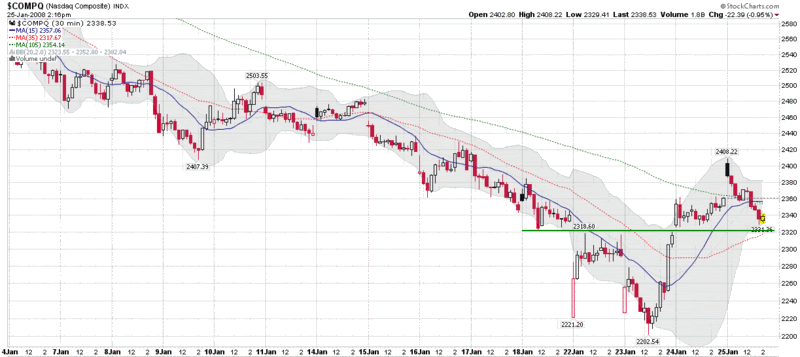
In looking at a chart of NASDAQ composite, the obvious ultimate support level is the 2202 bottom that was put in on Wednesday. Almost as important, however, is the green line at about 2320-2325 that I have added to the 30 minute chart below. For the moment at least, 2320 is the critical line in the sand. This line highlights important gaps on Wednesday and Thursday that served as resistance on both days, as the bottom was forming. Now the 2320-2325 area appears to have flipped from resistance to support in the face of today’s downturn.

It is way too early to draw any conclusions about the bottom earlier in the week, but there is a possibility that we are seeing the first higher low, which would move the battlefield to the 2220-2410 arena – the full extent of today’s range. About the only thing I can say with confidence at this point is that the game is afoot. How well the bulls defend 2320 should go a long way to determining whether this week’s action will turn out to be an important bottom. If 2320 falls, I suspect it will be very difficult to rally sufficient support to make 2202 hold.

Thursday, January 24, 2008

Reversal Bar Analysis at Quantifiable Edges

I have been impressed by the breadth of top notch analytical thinking across the investment blog world in the past few weeks and have found many insights of note from some of the stalwarts on my blogroll. For the moment, however, I want to highlight one new blog, Quantifiable Edges, authored by Rob Hanna, that has particularly impressed me with some timely and thought provoking analysis.

Rob just happens to be in the midst of publishing some excellent work he has been doing on reversal bars – a subject that should be top of mind for all traders, given the recent market action. I encourage readers to click through and have a look: Quantifiable Edges on reversal bars

MBI, Bond Insurers, and Volatility

One of the more interesting – and important – subplots to keep an eye on during the current market difficulties is that of the bond insurers. The two most prominent of these bond insurers, MBIA (MBI) and Ambac (ABK), are in the news today with reports that the New York Insurance Superintendent is trying to arrange a capital infusion from the likes of Goldman Sachs (GS), Merrill Lynch (MER), JPMorgan (JPM), Citigroup (C), and Wachovia (WB). Presumably, the Fed is doing some arm twisting and offering some financial incentives behind the scenes, as a failure to resolve the problems with the bond insurers would likely trigger systemic havoc and involve a long and expensive list of dominoes in the process.

Eric Dinallo, the New York Insurance Superintendent, was quoted earlier today as saying that while a rapid resolution is essential, ironing out the details of a bailout may take awhile. “It is important to resolve issues related to the bond insurers as soon as possible,” Dinallo noted, while cautioning “these are complicated issues involving a number of parties and any effective plan will take some time to finalize.”

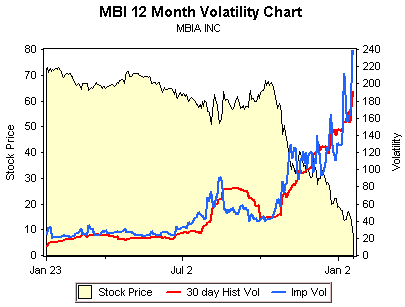
While most investors should be thinking about the bond insurer issue in terms of its impact on the broader markets, there are some interesting plays on bond issuers themselves. As reported in 24/7 Wall Street, Goldman Sachs laid out some potential valuations under three different scenarios, ranging from the bond insurers’ being unable to raise enough capital to mollify the rating agencies to a situation where the capital raised enables the bond insurers to continue to operate as they had in a pre-crisis mode. Looking just at MBI, the valuation spread ranges from $6 to $48.

Investments don’t get much more speculative than this, as the chart from optionsXpress above shows. For the record, all February puts now carry an implied volatility of more than 200. While I am not going to recommend a specific trade here, there are some fascinating options spreads and ratio spreads to look at for those who believe that the Goldman scenarios and numbers are in the ballpark.

Wednesday, January 23, 2008

NDX Fails Briefly, Other Indices Hold Bottoms

Bottoms are an interesting species. They are almost impossible to call in advance and surprisingly difficult to identify with a little hindsight. Typically, by the time you have enough hindsight to say, “Hey that was a bottom back there!” you have already missed a good portion of the move up from that point.

A number of indicators can help raise the probability of calling a bottom, the VIX among them, but we are still in the meteorological realm in terms of accuracy – and very much in the pre-Doppler era at that.

Most students of market bottoms agree that evidence of widespread capitulation is the best way to identify a market bottom. The reasoning is essentially that it is ‘better’ to have one day of extreme investor panic than a number of days in which the cumulative losses add up to one big drop while the psyche of the investor is able to digest the grief on the installment.

According to the reasoning above, yesterday had some elements of extreme investor panic at the open, but the ease with which the markets rallied from that point suggest that there may not have been enough panic or pain to account for a traditional capitulation bottom. This morning’s open was also relatively low in terms of panic and pain – at least on the capitulation scale – so there will be many who will wait for another strong retest of yesterday’s lows (and of investor fortitude) before committing to new bullish positions.

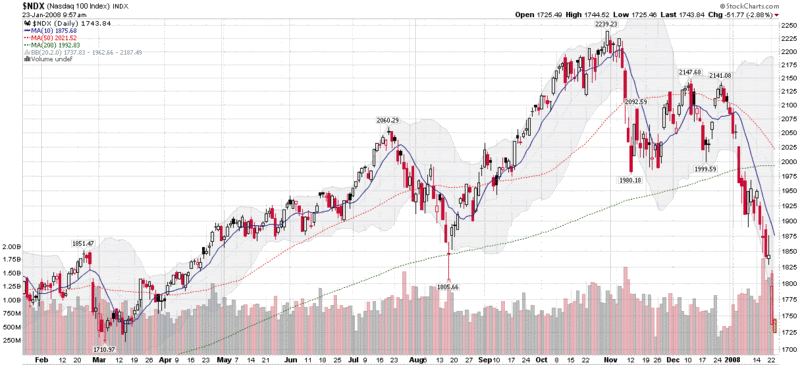
It is worth noting that one major index had yesterday’s low breached this morning: the NASDAQ-100 (NDX). Thanks to AAPL’s weak guidance yesterday after the bell, the stock opened dramatically lower and pulled the NDX down with it. The NDX has since recovered, but it and AAPL should be watched closely, as their support levels will likely be tested before those of the other more widely followed indices.

Tuesday, January 22, 2008

Brunhilde Day Today?

Today could turn out to be one of those days that imprints the value of the VIX deeply into the psyche of many traders.
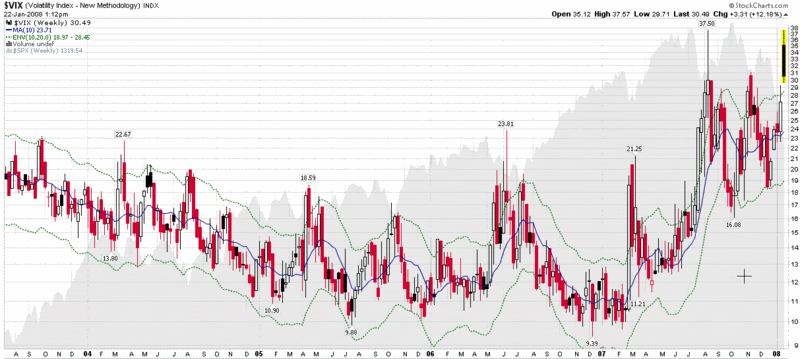
While I have gone out of my way to suggest that the markets do not have to see a VIX spike in order to put in a bottom, it appears that following this morning’s surge in the VIX to 37.57 (the highest reading since October 2002) many buyers felt comfortable starting to nibble. Now with the markets inching back toward even for the day, the likelihood of a high volume reversal day signaling a market bottom is increasing dramatically.

While I have done some nibbling of my own, I would not be surprised to see at least one test of the lows of the morning and would hold off on calling a bottom until we see more evidence of higher lows and higher highs.

On the other hand, if today turns out to be a bottom, you can bet that that next time we have a major selloff, traders will be watching the VIX even more intently to determine when it signals that bottom. If the VIX was important before today, it is about to become even more important going forward, when traders eagerly watch to see when Brunhilde is going to sing.

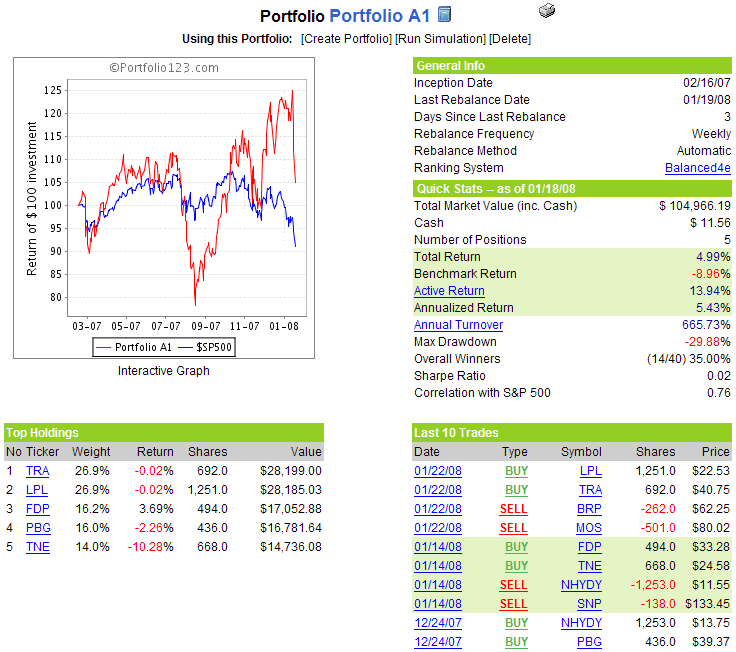
Portfolio A1 Falls as Mosaic’s Run Comes to an End

It was fun while it lasted, but it had to come to an end eventually. The Mosaic Company (MOS), which had run up an eye opening 176% in the first five months it was in Portfolio A1, is now gone from stable, victim of a rule that automatically culls any stock that falls 20% from the high recorded during the holding period. Also shown the door as a result of a 20% drop is Brazil Telecom Participacoes (BRP).

Replacing MOS and BRP are LG Philips LCD Co. (LPL) and Terra Industries (TRA). LG Philips LCD Co. is a Seoul-based $16 billion joint venture in the display business between two global giants, LG Electronics and Royal Philips Electronics. TRA, a nitrogen fertilizer company, demonstrates how some portfolio ‘rules’ can backfire, as this company is a direct competitor of Mosaic in the fertilizer business and at only 10% of Mosaic’s market capitalization is actually a much riskier play in this sector. Nevertheless, the stock ranker has spoken and TRA should do well if this week turns out to be a bottom. As far as the wisdom of holding an LCD manufacturer at a point where consumer demand appears to be drying up, I am skeptical, but this remains a 100% mechanical portfolio, where my perspective does not matter.

After falling 11.4% last week, Portfolio A1 is still sporting a 5% gain since the February 16, 2007 inception, considerably better than the 9% loss in the benchmark S&P 500 index during the same period.

There no other changes to the portfolio this week.

A snapshot of the Portfolio A1 is as follows:

VWSI at +1 as Historic Meltdown Approaches

In light of the oncoming freight train that is today’s session, it seems somewhat academic to recount the action in the VIX last week. For the record, last week the VIX gained 3.50 points (14.8%) to close out the week at 27.18. The VWSI rose one tick to +1.

As is my weekly custom, for a survey of the best in current thinking about the markets, Barry Ritholtz at The Big Picture sums up the week that was and takes a stab at what will likely be a historic trading week in his 3 Day Weekend Linkfest: Review/Preview (authored Sunday evening, so it doesn’t include the thinking coming out of yesterday’s carnage.)

I am estimating that the VIX will open between 35 and 36, then move higher from that level as the rush to the exits precludes the need for anyone to yell “Fire!” A VIX north of 40 would not surprise me, nor would a short-term bottom forming sometime later in the week.

(Note that in the above temperature gauge, the "bullish" and "bearish" labels apply to the VIX, not to the broader markets, which are usually negatively correlated with the VIX.)

Wine pairing: For a VWSI of +1, I recommend a guwurztraminer. For the record, my favorite American version of this wine is the dry gewurztraminer from Londer Vineyards of Anderson Valley. I have not yet sampled the 2006 vintage, but the 2005 was an unforgettable wine that I would love to see in a blind tasting against some of the top Alsatian competition.

In my previous roundup of California gewurztraminer, I suggested Navarro and Harvest Moon. For some of my top selections from Alsace, check out Trimbach; Hugel; and Domaine Weinbach. You can also check out the top-rated gewurztraminers in the 2007 San Francisco Chronicle Wine Competition.

Friday, January 18, 2008

Will a 29.30 VIX Placate the Crowd?

Until the past few days, I did not realize how many investors – or at least pundits – are of the opinion that the market cannot put in a bottom until the VIX spikes. True, the classic market bottom includes a dramatic drop, a spike in volume, and a spike in investor fear to purge even the most stubborn investors of their losing long positions. As I have stated previously, however, I am comfortable in my belief that a VIX spike strongly increases the likelihood of a bottom, but should not be considered a requirement, per se.

Consider, for a moment, that a VIX spike capitulation bottom may be one of those investment phenomena in which one’s individual assessment doesn’t matter. If enough people believe that A is a precondition for B and trade accordingly, just about any A can become a self-fulfilling prophecy.

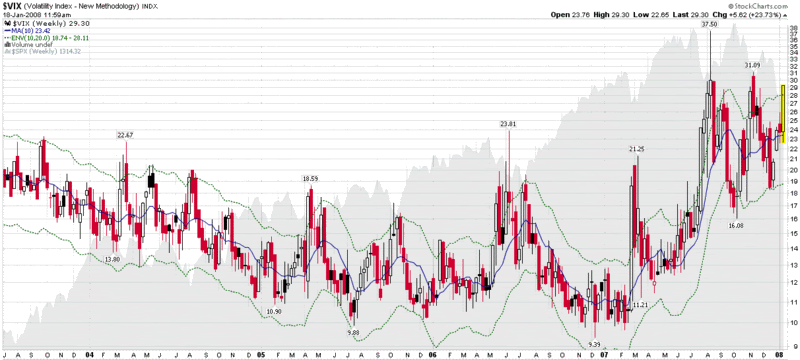
Back to the VIX spike, we just hit 29.30 on the VIX a moment ago. While some were calling for the VIX to cross 30 to signal a market bottom, it is possible that the current level may be considered close enough to draw in those looking to play the oversold bounce card.

I have chosen to include a weekly chart of the VIX as a framework for evaluating the current VIX spike. It shows that a 20% deviation from the 10 week SMA has proven to be a fairly reliable timing device in the past. It remains to be seen whether that is the case today, but I am not anticipating a VIX spike over 30 between now and the next Fed meeting.

Thursday, January 17, 2008

Bernanke Prepared Remarks Sink ISEE to Historic Lows

The ISEE is at historic lows with Ben Bernanke 1 1/2 hours into his testimony before the House Budget Committee.

Between 9:50 and 10:10 a.m. EST, approximately 290,000 new put positions were opened in individual equities on the ISEE. This is in sharp contrast to the meager 34,000 or so new call positions that were initiated during the same period.

Given that a copy of Bernanke's prepared remarks we distributed at approximately 10:00, the mostly likely conclusion is that some of the larger players are voting with their feet that the Fed's too little too late approach continues to offer a significant downside opportunity for those who are short the market.

At 11:30 a.m., the ISEE has climbed to 37, but with such a large number of puts already up on the scoreboard, there is a good chance that today will see a new single day closing low for the ISEE.

DISCLAIMER: "VIX®" is a trademark of Chicago Board Options Exchange, Incorporated. Chicago Board Options Exchange, Incorporated is not affiliated with this website or this website's owner's or operators. CBOE assumes no responsibility for the accuracy or completeness or any other aspect of any content posted on this website by its operator or any third party. All content on this site is provided for informational and entertainment purposes only and is not intended as advice to buy or sell any securities. Stocks are difficult to trade; options are even harder. When it comes to VIX derivatives, don't fall into the trap of thinking that just because you can ride a horse, you can ride an alligator. Please do your own homework and accept full responsibility for any investment decisions you make. No content on this site can be used for commercial purposes without the prior written permission of the author. Copyright © 2007-2023 Bill Luby. All rights reserved.
 
Web Analytics