The Credit Default Swap Canary
 Raise your hand if you were following were watching the Bombay Sensex for clues about the future of the Chinese market or were wise to the unwinding of the Yen carry trade before it happened. Maybe you were tipped off to the subprime mortgage debacle. If so, you did a better job than most investors.
I won’t say that keeping a weather eye on the VIX would have guaranteed that you found yourself on the right side of the markets on 2/27, but it would have helped. Careful study of the equity put to call ratio would also probably have helped.
Let me nominate another canary to add to the investment coal mine: credit default swaps. I know, I’m not a bond guy either, but keeping an eye on how the markets are pricing default risk (the spread versus the US Treasury yield curve) is somewhat of a bond analog for how equity risk is priced in with the VIX.
I highly recommend watching the credit default swap index for high yield corporate bonds. A snapshot of this index is available at Yahoo, but much more information is available through Markit (click on the Dow Jones CDX.NA.HY link to pull up the graph below). Note that in the high yield graph, the market discounted 1/3 of the risk premium from September to Feburary and is now going through wild gyrations in an effort to re-price the risk premium to better match current expectations.
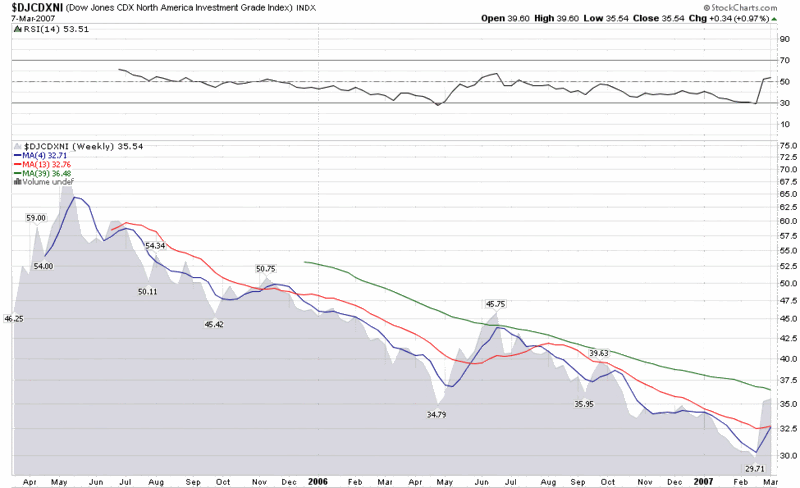
I should also note that while StockCharts.com does not provide charts for the high yield credit default index, they do offer charts for a sister index, the investment grade credit default index, whose weekly chart I have included below. The IG index chart suggests that the recent turmoil in the bond markets is less than what transpired during the May-July sell-off of last year and does little to reverse the 20 month trend of increasingly narrowing credit default spreads.
The bottom line is that it is always good to have a canary that you watch closely to help call market tops and bottoms. It can’t hurt to have several canaries, each with their own unique sensitivities.


5 comments:
Bill,
Thanks for the Markit Link.
A question if you don't mind. I'm not big on the Put/Call ratio as a "canary". As I understand it, it just represents open interest. Since you don't know the long vs short interest, it could be misleading; at least during times when many traders are selling puts. My brokerage (optionsXpress) does break out separate long and short ratios which I do like to look at but of course that only represents data from their accounts. Can you explain the value you find in the Put/Call and why I might be wrong?
Thanks and best of luck with your new blog.
Ron
Good question, Ron, and certainly one that deserves a more elaborate response than I will provide here -- but I will definitely post in more detail about the P/C ratio in the near future.
Frankly, the reason I have not mentioned the P/C ratio previously in this blog is that I am not a big fan and use it more for confirmation than as a primary indicator -- and more for finding market bottoms than market tops. I primarily use a 4 week and 20 day SMAs in combination with a couple of oscillators. As you point out, I look at open interest in the CPCE:
http://stockcharts.com/charts/gallery.html?$cpce
Where can I get the long and short ratios on optionsXpress? I looked, but couldn't find that info.
Cheers,
-Bill
Bill,
Thanks for the response. Look forward to those (and other) posts.
re: "Where can I get the long and short ratios on optionsXpress?"
They have those seven navigation tabs at the top of the page. Select the one labled "Quotes". Then, from the sub-menu, select "Markets". That brings up a page labled "Market Overview". The ratios are in the upper-right area of that page.
Ron
Thanks for the tip, Ron.
For those that may be wondering, optionsXpress has 30, 90 and 180 charts (but no raw data that I could put my hands on) for the ratio of long puts to long calls as well as short puts to short calls for their total customer accounts.
Excellent --and very useful-- post
Post a Comment